Pennsylvania German vs Sierra Leonean Male Poverty
COMPARE
Pennsylvania German
Sierra Leonean
Male Poverty
Male Poverty Comparison
Pennsylvania Germans
Sierra Leoneans
11.2%
MALE POVERTY
50.5/ 100
METRIC RATING
173rd/ 347
METRIC RANK
11.4%
MALE POVERTY
29.9/ 100
METRIC RATING
188th/ 347
METRIC RANK
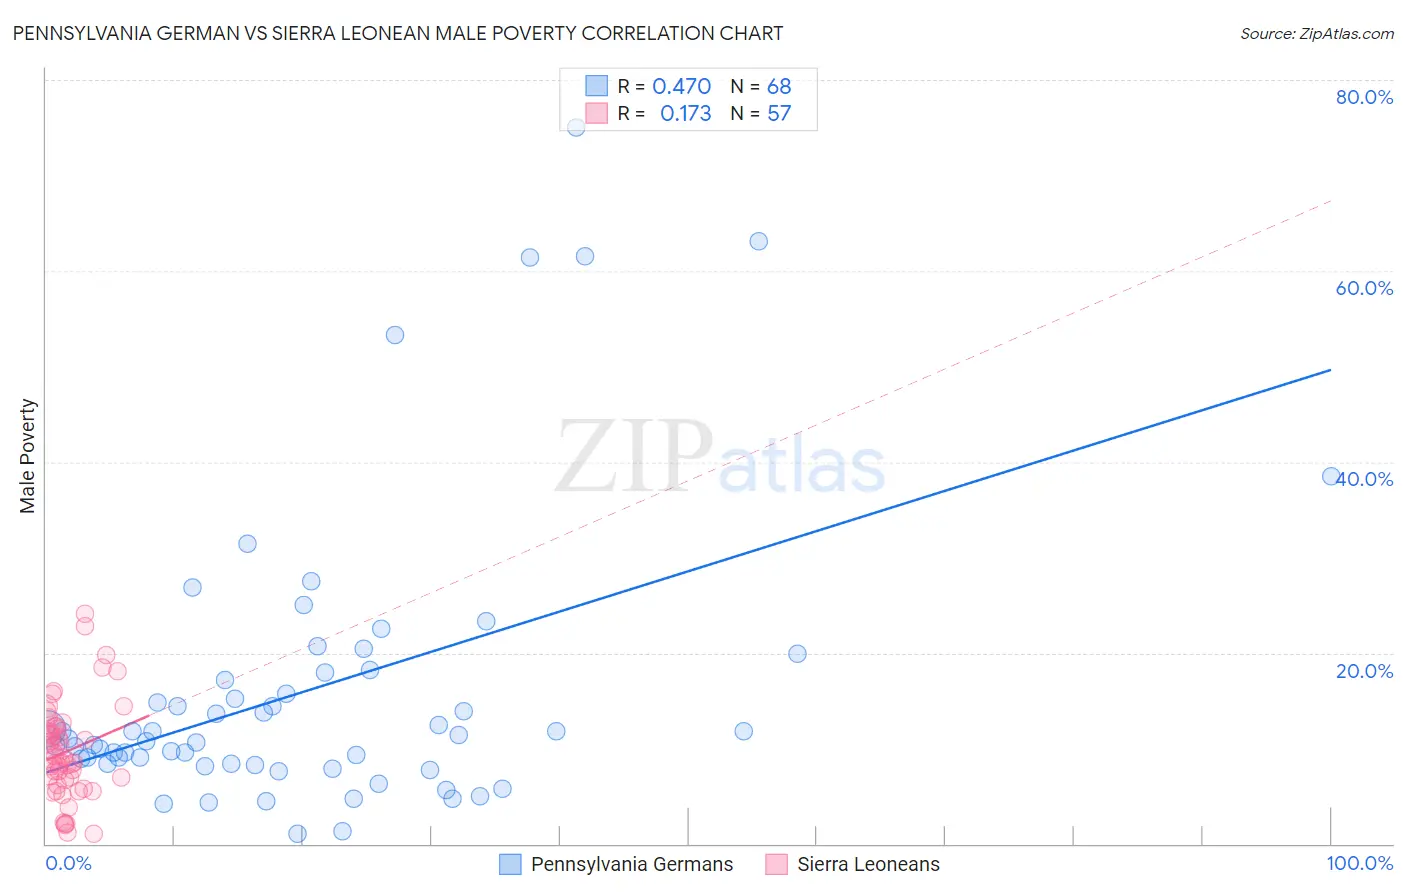
Pennsylvania German vs Sierra Leonean Male Poverty Correlation Chart
The statistical analysis conducted on geographies consisting of 233,970,359 people shows a moderate positive correlation between the proportion of Pennsylvania Germans and poverty level among males in the United States with a correlation coefficient (R) of 0.470 and weighted average of 11.2%. Similarly, the statistical analysis conducted on geographies consisting of 83,343,100 people shows a poor positive correlation between the proportion of Sierra Leoneans and poverty level among males in the United States with a correlation coefficient (R) of 0.173 and weighted average of 11.4%, a difference of 2.1%.
Male Poverty Correlation Summary
| Measurement | Pennsylvania German | Sierra Leonean |
| Minimum | 1.1% | 1.0% |
| Maximum | 75.0% | 24.2% |
| Range | 73.9% | 23.1% |
| Mean | 16.1% | 9.7% |
| Median | 11.2% | 9.0% |
| Interquartile 25% (IQ1) | 8.3% | 6.4% |
| Interquartile 75% (IQ3) | 17.5% | 12.2% |
| Interquartile Range (IQR) | 9.2% | 5.8% |
| Standard Deviation (Sample) | 15.1% | 5.0% |
| Standard Deviation (Population) | 15.0% | 5.0% |
Demographics Similar to Pennsylvania Germans and Sierra Leoneans by Male Poverty
In terms of male poverty, the demographic groups most similar to Pennsylvania Germans are Immigrants from Ethiopia (11.2%, a difference of 0.020%), Immigrants from Oceania (11.2%, a difference of 0.040%), Uruguayan (11.2%, a difference of 0.060%), Celtic (11.2%, a difference of 0.29%), and South American (11.1%, a difference of 0.32%). Similarly, the demographic groups most similar to Sierra Leoneans are Hawaiian (11.4%, a difference of 0.18%), Immigrants from Iraq (11.4%, a difference of 0.22%), Immigrants from Sierra Leone (11.4%, a difference of 0.33%), Immigrants from Afghanistan (11.4%, a difference of 0.38%), and Israeli (11.5%, a difference of 0.45%).
| Demographics | Rating | Rank | Male Poverty |
| South Americans | 53.8 /100 | #170 | Average 11.1% |
| Uruguayans | 51.0 /100 | #171 | Average 11.2% |
| Immigrants | Ethiopia | 50.7 /100 | #172 | Average 11.2% |
| Pennsylvania Germans | 50.5 /100 | #173 | Average 11.2% |
| Immigrants | Oceania | 50.0 /100 | #174 | Average 11.2% |
| Celtics | 47.5 /100 | #175 | Average 11.2% |
| Immigrants | Fiji | 46.0 /100 | #176 | Average 11.2% |
| Lebanese | 45.6 /100 | #177 | Average 11.2% |
| Immigrants | Cameroon | 44.5 /100 | #178 | Average 11.2% |
| Immigrants | Syria | 40.3 /100 | #179 | Average 11.3% |
| Immigrants | Morocco | 40.1 /100 | #180 | Average 11.3% |
| Immigrants | Costa Rica | 39.5 /100 | #181 | Fair 11.3% |
| Mongolians | 39.0 /100 | #182 | Fair 11.3% |
| Kenyans | 38.4 /100 | #183 | Fair 11.3% |
| Immigrants | South America | 36.9 /100 | #184 | Fair 11.3% |
| Immigrants | Afghanistan | 33.3 /100 | #185 | Fair 11.4% |
| Immigrants | Sierra Leone | 32.9 /100 | #186 | Fair 11.4% |
| Immigrants | Iraq | 31.9 /100 | #187 | Fair 11.4% |
| Sierra Leoneans | 29.9 /100 | #188 | Fair 11.4% |
| Hawaiians | 28.3 /100 | #189 | Fair 11.4% |
| Israelis | 26.1 /100 | #190 | Fair 11.5% |