South American vs Sierra Leonean Unemployment
COMPARE
South American
Sierra Leonean
Unemployment
Unemployment Comparison
South Americans
Sierra Leoneans
5.3%
UNEMPLOYMENT
33.9/ 100
METRIC RATING
192nd/ 347
METRIC RANK
5.8%
UNEMPLOYMENT
0.1/ 100
METRIC RATING
262nd/ 347
METRIC RANK
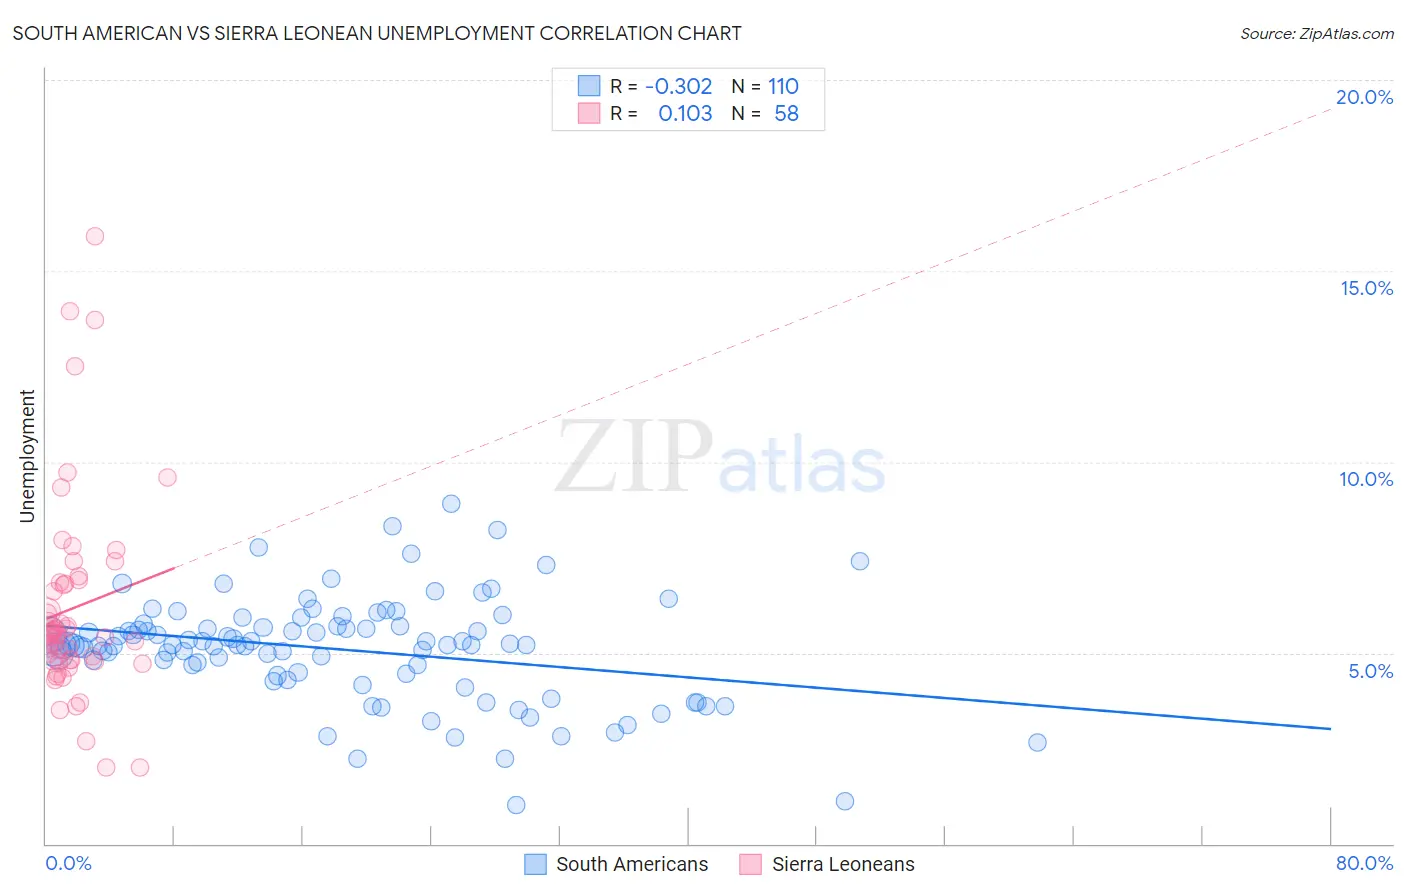
South American vs Sierra Leonean Unemployment Correlation Chart
The statistical analysis conducted on geographies consisting of 493,239,176 people shows a mild negative correlation between the proportion of South Americans and unemployment in the United States with a correlation coefficient (R) of -0.302 and weighted average of 5.3%. Similarly, the statistical analysis conducted on geographies consisting of 83,351,877 people shows a poor positive correlation between the proportion of Sierra Leoneans and unemployment in the United States with a correlation coefficient (R) of 0.103 and weighted average of 5.8%, a difference of 9.2%.
Unemployment Correlation Summary
| Measurement | South American | Sierra Leonean |
| Minimum | 1.0% | 2.0% |
| Maximum | 8.9% | 15.9% |
| Range | 7.9% | 13.9% |
| Mean | 5.1% | 6.2% |
| Median | 5.2% | 5.5% |
| Interquartile 25% (IQ1) | 4.5% | 4.8% |
| Interquartile 75% (IQ3) | 5.7% | 6.8% |
| Interquartile Range (IQR) | 1.2% | 2.0% |
| Standard Deviation (Sample) | 1.4% | 2.7% |
| Standard Deviation (Population) | 1.4% | 2.7% |
Similar Demographics by Unemployment
Demographics Similar to South Americans by Unemployment
In terms of unemployment, the demographic groups most similar to South Americans are Somali (5.3%, a difference of 0.0%), Immigrants from Somalia (5.3%, a difference of 0.010%), Arab (5.3%, a difference of 0.090%), Immigrants from Belarus (5.3%, a difference of 0.11%), and Alsatian (5.3%, a difference of 0.21%).
| Demographics | Rating | Rank | Unemployment |
| Immigrants | Thailand | 38.9 /100 | #185 | Fair 5.3% |
| Immigrants | Uganda | 37.8 /100 | #186 | Fair 5.3% |
| Costa Ricans | 37.4 /100 | #187 | Fair 5.3% |
| Alsatians | 37.0 /100 | #188 | Fair 5.3% |
| Immigrants | Belarus | 35.6 /100 | #189 | Fair 5.3% |
| Arabs | 35.3 /100 | #190 | Fair 5.3% |
| Somalis | 34.0 /100 | #191 | Fair 5.3% |
| South Americans | 33.9 /100 | #192 | Fair 5.3% |
| Immigrants | Somalia | 33.8 /100 | #193 | Fair 5.3% |
| Immigrants | Laos | 30.9 /100 | #194 | Fair 5.3% |
| Immigrants | Southern Europe | 30.9 /100 | #195 | Fair 5.3% |
| Peruvians | 29.9 /100 | #196 | Fair 5.3% |
| Immigrants | Uruguay | 29.8 /100 | #197 | Fair 5.3% |
| Immigrants | Israel | 28.6 /100 | #198 | Fair 5.3% |
| Immigrants | Afghanistan | 28.6 /100 | #199 | Fair 5.3% |
Demographics Similar to Sierra Leoneans by Unemployment
In terms of unemployment, the demographic groups most similar to Sierra Leoneans are Salvadoran (5.8%, a difference of 0.030%), Immigrants from Guatemala (5.8%, a difference of 0.10%), Immigrants from Uzbekistan (5.8%, a difference of 0.12%), Immigrants from Liberia (5.8%, a difference of 0.13%), and Subsaharan African (5.8%, a difference of 0.14%).
| Demographics | Rating | Rank | Unemployment |
| Immigrants | Portugal | 0.2 /100 | #255 | Tragic 5.7% |
| Guatemalans | 0.2 /100 | #256 | Tragic 5.8% |
| Yaqui | 0.2 /100 | #257 | Tragic 5.8% |
| Immigrants | Bahamas | 0.1 /100 | #258 | Tragic 5.8% |
| Sub-Saharan Africans | 0.1 /100 | #259 | Tragic 5.8% |
| Immigrants | Uzbekistan | 0.1 /100 | #260 | Tragic 5.8% |
| Immigrants | Guatemala | 0.1 /100 | #261 | Tragic 5.8% |
| Sierra Leoneans | 0.1 /100 | #262 | Tragic 5.8% |
| Salvadorans | 0.1 /100 | #263 | Tragic 5.8% |
| Immigrants | Liberia | 0.1 /100 | #264 | Tragic 5.8% |
| Nigerians | 0.1 /100 | #265 | Tragic 5.8% |
| Mexican American Indians | 0.1 /100 | #266 | Tragic 5.8% |
| Immigrants | Nigeria | 0.1 /100 | #267 | Tragic 5.8% |
| Immigrants | Sierra Leone | 0.1 /100 | #268 | Tragic 5.8% |
| Immigrants | El Salvador | 0.1 /100 | #269 | Tragic 5.8% |