Immigrants from Indonesia vs Sierra Leonean Male Poverty
COMPARE
Immigrants from Indonesia
Sierra Leonean
Male Poverty
Male Poverty Comparison
Immigrants from Indonesia
Sierra Leoneans
10.5%
MALE POVERTY
93.3/ 100
METRIC RATING
99th/ 347
METRIC RANK
11.4%
MALE POVERTY
29.9/ 100
METRIC RATING
188th/ 347
METRIC RANK
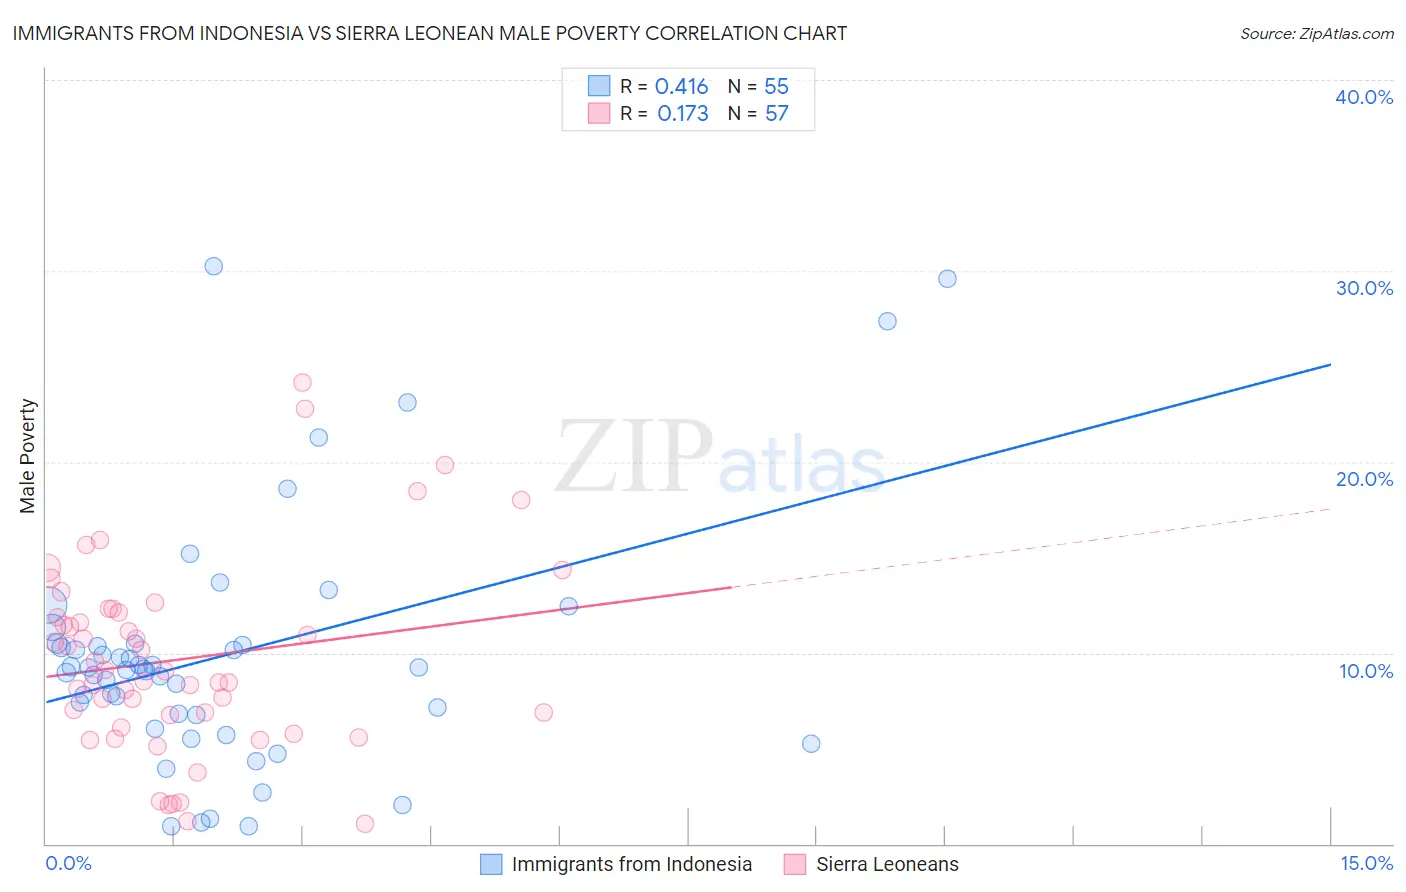
Immigrants from Indonesia vs Sierra Leonean Male Poverty Correlation Chart
The statistical analysis conducted on geographies consisting of 215,697,022 people shows a moderate positive correlation between the proportion of Immigrants from Indonesia and poverty level among males in the United States with a correlation coefficient (R) of 0.416 and weighted average of 10.5%. Similarly, the statistical analysis conducted on geographies consisting of 83,343,100 people shows a poor positive correlation between the proportion of Sierra Leoneans and poverty level among males in the United States with a correlation coefficient (R) of 0.173 and weighted average of 11.4%, a difference of 9.1%.
Male Poverty Correlation Summary
| Measurement | Immigrants from Indonesia | Sierra Leonean |
| Minimum | 0.89% | 1.0% |
| Maximum | 30.3% | 24.2% |
| Range | 29.4% | 23.1% |
| Mean | 9.9% | 9.7% |
| Median | 9.2% | 9.0% |
| Interquartile 25% (IQ1) | 6.8% | 6.4% |
| Interquartile 75% (IQ3) | 10.5% | 12.2% |
| Interquartile Range (IQR) | 3.7% | 5.8% |
| Standard Deviation (Sample) | 6.4% | 5.0% |
| Standard Deviation (Population) | 6.3% | 5.0% |
Similar Demographics by Male Poverty
Demographics Similar to Immigrants from Indonesia by Male Poverty
In terms of male poverty, the demographic groups most similar to Immigrants from Indonesia are Finnish (10.5%, a difference of 0.060%), Romanian (10.5%, a difference of 0.13%), Immigrants from Egypt (10.4%, a difference of 0.18%), Immigrants from Latvia (10.5%, a difference of 0.21%), and Scottish (10.4%, a difference of 0.31%).
| Demographics | Rating | Rank | Male Poverty |
| Jordanians | 94.4 /100 | #92 | Exceptional 10.4% |
| Australians | 94.4 /100 | #93 | Exceptional 10.4% |
| Immigrants | South Africa | 94.1 /100 | #94 | Exceptional 10.4% |
| Scottish | 94.0 /100 | #95 | Exceptional 10.4% |
| Immigrants | Egypt | 93.7 /100 | #96 | Exceptional 10.4% |
| Romanians | 93.6 /100 | #97 | Exceptional 10.5% |
| Finns | 93.4 /100 | #98 | Exceptional 10.5% |
| Immigrants | Indonesia | 93.3 /100 | #99 | Exceptional 10.5% |
| Immigrants | Latvia | 92.8 /100 | #100 | Exceptional 10.5% |
| Immigrants | Zimbabwe | 92.0 /100 | #101 | Exceptional 10.5% |
| French Canadians | 91.9 /100 | #102 | Exceptional 10.5% |
| Slavs | 91.7 /100 | #103 | Exceptional 10.5% |
| Welsh | 91.6 /100 | #104 | Exceptional 10.5% |
| Canadians | 91.6 /100 | #105 | Exceptional 10.5% |
| Immigrants | Southern Europe | 91.3 /100 | #106 | Exceptional 10.5% |
Demographics Similar to Sierra Leoneans by Male Poverty
In terms of male poverty, the demographic groups most similar to Sierra Leoneans are Hawaiian (11.4%, a difference of 0.18%), Immigrants from Iraq (11.4%, a difference of 0.22%), Immigrants from Sierra Leone (11.4%, a difference of 0.33%), Immigrants from Afghanistan (11.4%, a difference of 0.38%), and Israeli (11.5%, a difference of 0.45%).
| Demographics | Rating | Rank | Male Poverty |
| Immigrants | Costa Rica | 39.5 /100 | #181 | Fair 11.3% |
| Mongolians | 39.0 /100 | #182 | Fair 11.3% |
| Kenyans | 38.4 /100 | #183 | Fair 11.3% |
| Immigrants | South America | 36.9 /100 | #184 | Fair 11.3% |
| Immigrants | Afghanistan | 33.3 /100 | #185 | Fair 11.4% |
| Immigrants | Sierra Leone | 32.9 /100 | #186 | Fair 11.4% |
| Immigrants | Iraq | 31.9 /100 | #187 | Fair 11.4% |
| Sierra Leoneans | 29.9 /100 | #188 | Fair 11.4% |
| Hawaiians | 28.3 /100 | #189 | Fair 11.4% |
| Israelis | 26.1 /100 | #190 | Fair 11.5% |
| South American Indians | 22.8 /100 | #191 | Fair 11.5% |
| Immigrants | Uruguay | 19.1 /100 | #192 | Poor 11.6% |
| Immigrants | Kuwait | 17.3 /100 | #193 | Poor 11.6% |
| Immigrants | Kenya | 16.1 /100 | #194 | Poor 11.6% |
| Arabs | 15.8 /100 | #195 | Poor 11.6% |