Serbian vs French American Indian Family Poverty
COMPARE
Serbian
French American Indian
Family Poverty
Family Poverty Comparison
Serbians
French American Indians
8.0%
FAMILY POVERTY
97.2/ 100
METRIC RATING
88th/ 347
METRIC RANK
10.2%
FAMILY POVERTY
1.5/ 100
METRIC RATING
238th/ 347
METRIC RANK
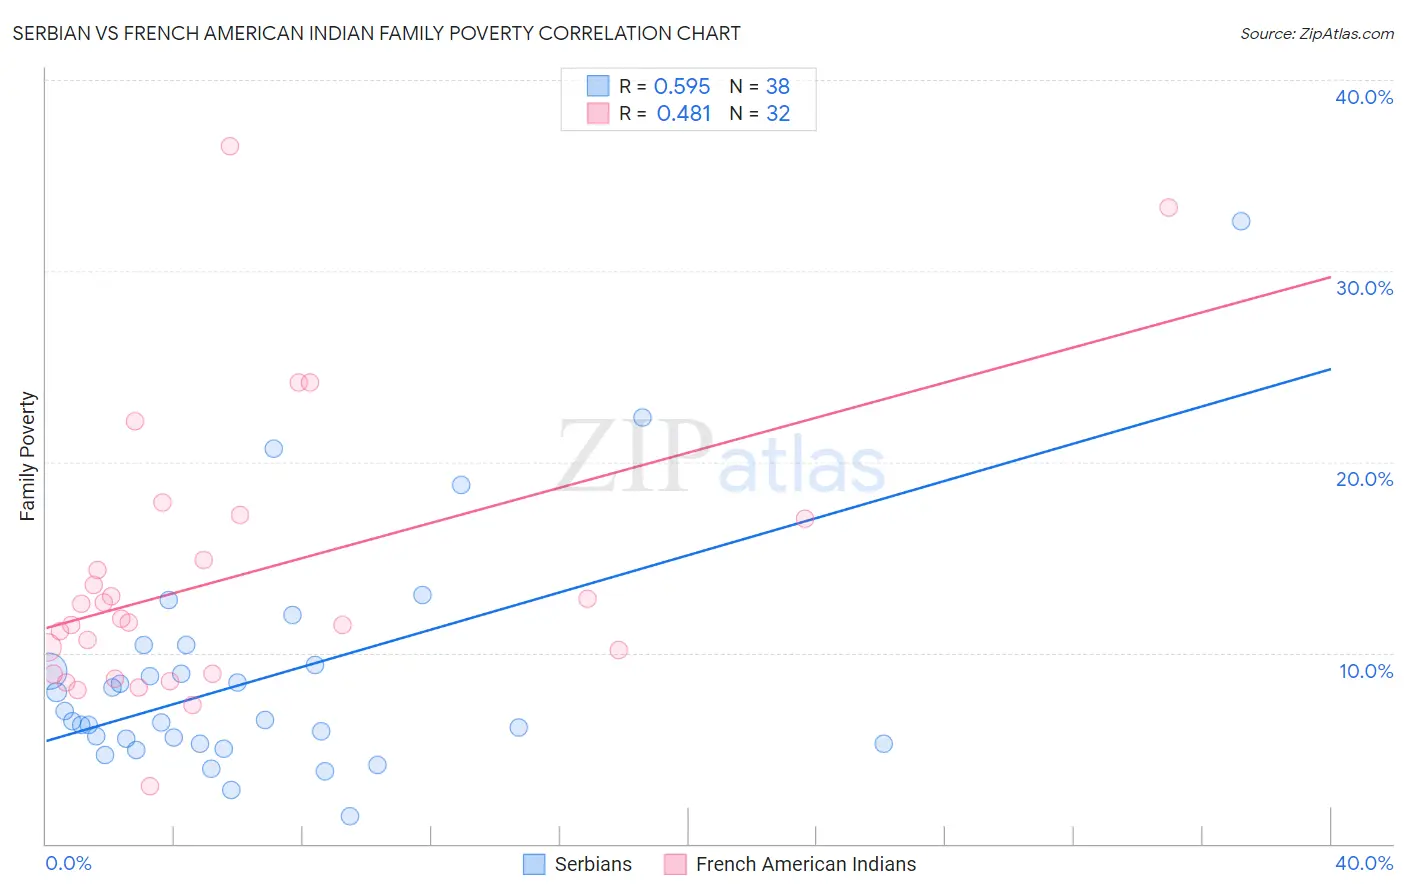
Serbian vs French American Indian Family Poverty Correlation Chart
The statistical analysis conducted on geographies consisting of 267,119,010 people shows a substantial positive correlation between the proportion of Serbians and poverty level among families in the United States with a correlation coefficient (R) of 0.595 and weighted average of 8.0%. Similarly, the statistical analysis conducted on geographies consisting of 131,838,011 people shows a moderate positive correlation between the proportion of French American Indians and poverty level among families in the United States with a correlation coefficient (R) of 0.481 and weighted average of 10.2%, a difference of 28.6%.
Family Poverty Correlation Summary
| Measurement | Serbian | French American Indian |
| Minimum | 1.4% | 3.0% |
| Maximum | 32.6% | 36.5% |
| Range | 31.2% | 33.5% |
| Mean | 8.7% | 13.9% |
| Median | 6.5% | 11.7% |
| Interquartile 25% (IQ1) | 5.3% | 8.9% |
| Interquartile 75% (IQ3) | 9.4% | 16.0% |
| Interquartile Range (IQR) | 4.1% | 7.1% |
| Standard Deviation (Sample) | 6.1% | 7.3% |
| Standard Deviation (Population) | 6.0% | 7.2% |
Similar Demographics by Family Poverty
Demographics Similar to Serbians by Family Poverty
In terms of family poverty, the demographic groups most similar to Serbians are Belgian (8.0%, a difference of 0.070%), Scottish (7.9%, a difference of 0.15%), Immigrants from Denmark (8.0%, a difference of 0.15%), Immigrants from England (8.0%, a difference of 0.15%), and Immigrants from Asia (7.9%, a difference of 0.20%).
| Demographics | Rating | Rank | Family Poverty |
| Irish | 97.8 /100 | #81 | Exceptional 7.9% |
| Immigrants | Poland | 97.8 /100 | #82 | Exceptional 7.9% |
| Slovaks | 97.7 /100 | #83 | Exceptional 7.9% |
| British | 97.5 /100 | #84 | Exceptional 7.9% |
| Immigrants | Asia | 97.4 /100 | #85 | Exceptional 7.9% |
| Scottish | 97.3 /100 | #86 | Exceptional 7.9% |
| Belgians | 97.3 /100 | #87 | Exceptional 8.0% |
| Serbians | 97.2 /100 | #88 | Exceptional 8.0% |
| Immigrants | Denmark | 97.1 /100 | #89 | Exceptional 8.0% |
| Immigrants | England | 97.1 /100 | #90 | Exceptional 8.0% |
| Immigrants | Italy | 97.0 /100 | #91 | Exceptional 8.0% |
| Czechoslovakians | 96.8 /100 | #92 | Exceptional 8.0% |
| Tlingit-Haida | 96.7 /100 | #93 | Exceptional 8.0% |
| Immigrants | Pakistan | 96.6 /100 | #94 | Exceptional 8.0% |
| Immigrants | Philippines | 96.5 /100 | #95 | Exceptional 8.0% |
Demographics Similar to French American Indians by Family Poverty
In terms of family poverty, the demographic groups most similar to French American Indians are Potawatomi (10.2%, a difference of 0.040%), Immigrants from the Azores (10.3%, a difference of 0.35%), Immigrants from Laos (10.2%, a difference of 0.36%), Ghanaian (10.3%, a difference of 0.43%), and Immigrants from Nigeria (10.2%, a difference of 0.63%).
| Demographics | Rating | Rank | Family Poverty |
| Alaskan Athabascans | 2.7 /100 | #231 | Tragic 10.1% |
| Immigrants | Sudan | 2.3 /100 | #232 | Tragic 10.1% |
| Fijians | 2.1 /100 | #233 | Tragic 10.1% |
| Immigrants | Middle Africa | 2.1 /100 | #234 | Tragic 10.1% |
| Nigerians | 2.0 /100 | #235 | Tragic 10.1% |
| Immigrants | Nigeria | 1.9 /100 | #236 | Tragic 10.2% |
| Immigrants | Laos | 1.7 /100 | #237 | Tragic 10.2% |
| French American Indians | 1.5 /100 | #238 | Tragic 10.2% |
| Potawatomi | 1.5 /100 | #239 | Tragic 10.2% |
| Immigrants | Azores | 1.4 /100 | #240 | Tragic 10.3% |
| Ghanaians | 1.3 /100 | #241 | Tragic 10.3% |
| Alaska Natives | 1.0 /100 | #242 | Tragic 10.4% |
| Nepalese | 0.8 /100 | #243 | Tragic 10.4% |
| Cree | 0.7 /100 | #244 | Tragic 10.5% |
| Immigrants | Burma/Myanmar | 0.6 /100 | #245 | Tragic 10.5% |