Indian (Asian) vs Yakama Male Poverty
COMPARE
Indian (Asian)
Yakama
Male Poverty
Male Poverty Comparison
Indians (Asian)
Yakama
10.4%
MALE POVERTY
94.9/ 100
METRIC RATING
90th/ 347
METRIC RANK
15.3%
MALE POVERTY
0.0/ 100
METRIC RATING
325th/ 347
METRIC RANK
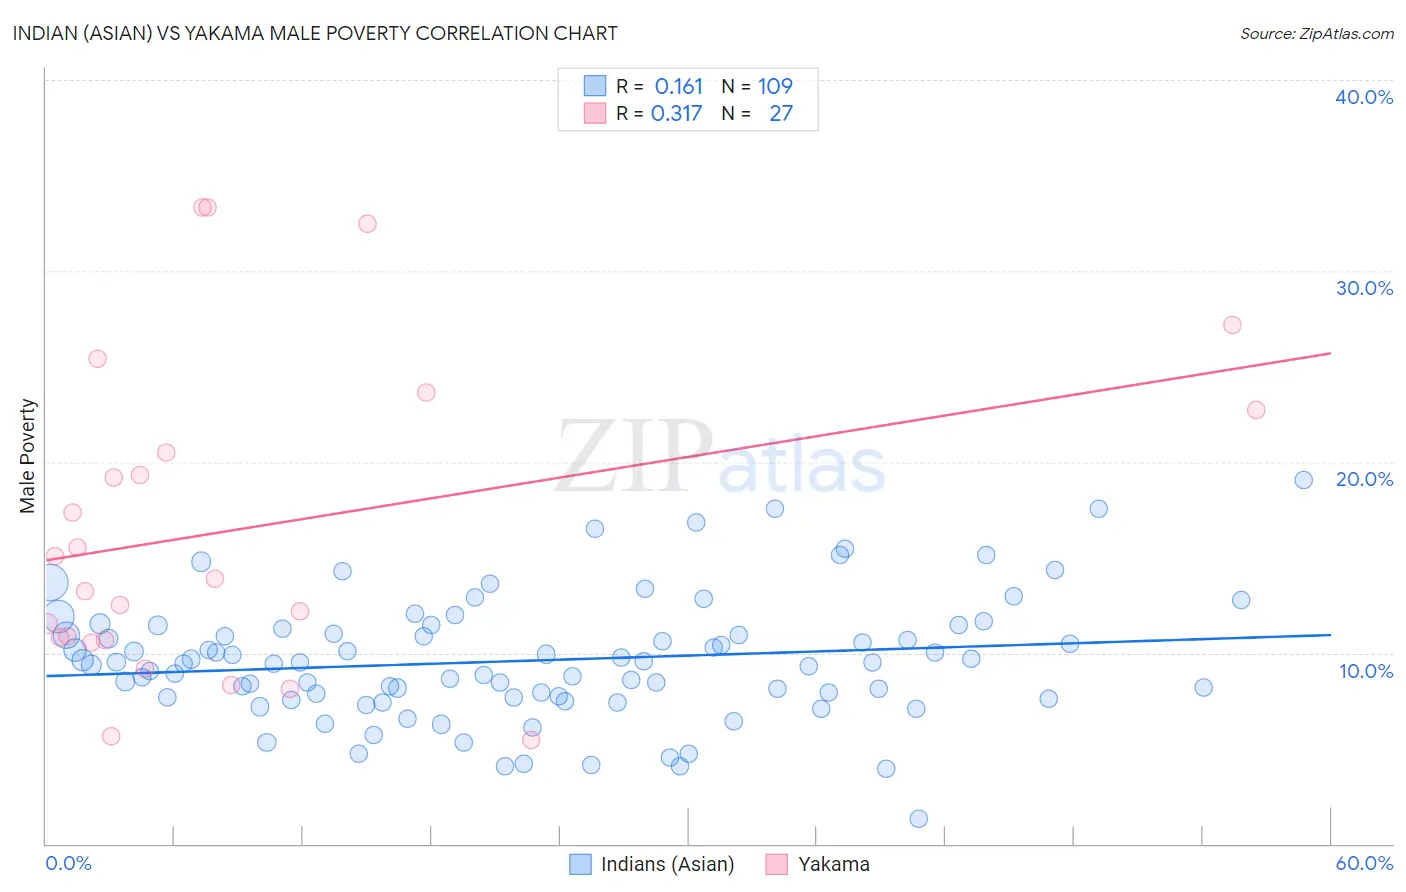
Indian (Asian) vs Yakama Male Poverty Correlation Chart
The statistical analysis conducted on geographies consisting of 494,421,628 people shows a poor positive correlation between the proportion of Indians (Asian) and poverty level among males in the United States with a correlation coefficient (R) of 0.161 and weighted average of 10.4%. Similarly, the statistical analysis conducted on geographies consisting of 19,917,879 people shows a mild positive correlation between the proportion of Yakama and poverty level among males in the United States with a correlation coefficient (R) of 0.317 and weighted average of 15.3%, a difference of 47.3%.
Male Poverty Correlation Summary
| Measurement | Indian (Asian) | Yakama |
| Minimum | 1.3% | 5.5% |
| Maximum | 19.1% | 33.3% |
| Range | 17.7% | 27.9% |
| Mean | 9.6% | 16.6% |
| Median | 9.5% | 13.8% |
| Interquartile 25% (IQ1) | 7.7% | 10.7% |
| Interquartile 75% (IQ3) | 11.1% | 22.7% |
| Interquartile Range (IQR) | 3.5% | 12.1% |
| Standard Deviation (Sample) | 3.2% | 8.3% |
| Standard Deviation (Population) | 3.2% | 8.1% |
Similar Demographics by Male Poverty
Demographics Similar to Indians (Asian) by Male Poverty
In terms of male poverty, the demographic groups most similar to Indians (Asian) are Immigrants from Denmark (10.4%, a difference of 0.020%), Cambodian (10.4%, a difference of 0.030%), British (10.4%, a difference of 0.070%), Northern European (10.4%, a difference of 0.17%), and Immigrants from Eastern Asia (10.4%, a difference of 0.20%).
| Demographics | Rating | Rank | Male Poverty |
| Immigrants | Sweden | 95.7 /100 | #83 | Exceptional 10.3% |
| Czechoslovakians | 95.6 /100 | #84 | Exceptional 10.3% |
| Immigrants | England | 95.5 /100 | #85 | Exceptional 10.4% |
| Immigrants | Eastern Asia | 95.3 /100 | #86 | Exceptional 10.4% |
| Northern Europeans | 95.2 /100 | #87 | Exceptional 10.4% |
| Cambodians | 95.0 /100 | #88 | Exceptional 10.4% |
| Immigrants | Denmark | 95.0 /100 | #89 | Exceptional 10.4% |
| Indians (Asian) | 94.9 /100 | #90 | Exceptional 10.4% |
| British | 94.8 /100 | #91 | Exceptional 10.4% |
| Jordanians | 94.4 /100 | #92 | Exceptional 10.4% |
| Australians | 94.4 /100 | #93 | Exceptional 10.4% |
| Immigrants | South Africa | 94.1 /100 | #94 | Exceptional 10.4% |
| Scottish | 94.0 /100 | #95 | Exceptional 10.4% |
| Immigrants | Egypt | 93.7 /100 | #96 | Exceptional 10.4% |
| Romanians | 93.6 /100 | #97 | Exceptional 10.5% |
Demographics Similar to Yakama by Male Poverty
In terms of male poverty, the demographic groups most similar to Yakama are Central American Indian (15.3%, a difference of 0.11%), Menominee (15.3%, a difference of 0.18%), Colville (15.2%, a difference of 0.37%), Kiowa (15.2%, a difference of 0.76%), and Arapaho (15.1%, a difference of 1.5%).
| Demographics | Rating | Rank | Male Poverty |
| Immigrants | Grenada | 0.0 /100 | #318 | Tragic 14.7% |
| U.S. Virgin Islanders | 0.0 /100 | #319 | Tragic 14.7% |
| Immigrants | Congo | 0.0 /100 | #320 | Tragic 14.7% |
| Arapaho | 0.0 /100 | #321 | Tragic 15.1% |
| Kiowa | 0.0 /100 | #322 | Tragic 15.2% |
| Colville | 0.0 /100 | #323 | Tragic 15.2% |
| Menominee | 0.0 /100 | #324 | Tragic 15.3% |
| Yakama | 0.0 /100 | #325 | Tragic 15.3% |
| Central American Indians | 0.0 /100 | #326 | Tragic 15.3% |
| Paiute | 0.0 /100 | #327 | Tragic 15.8% |
| Blacks/African Americans | 0.0 /100 | #328 | Tragic 15.8% |
| Dominicans | 0.0 /100 | #329 | Tragic 16.1% |
| Immigrants | Dominican Republic | 0.0 /100 | #330 | Tragic 16.2% |
| Ute | 0.0 /100 | #331 | Tragic 16.2% |
| Houma | 0.0 /100 | #332 | Tragic 16.7% |