Hawaiian vs Yakama Male Poverty
COMPARE
Hawaiian
Yakama
Male Poverty
Male Poverty Comparison
Hawaiians
Yakama
11.4%
MALE POVERTY
28.3/ 100
METRIC RATING
189th/ 347
METRIC RANK
15.3%
MALE POVERTY
0.0/ 100
METRIC RATING
325th/ 347
METRIC RANK
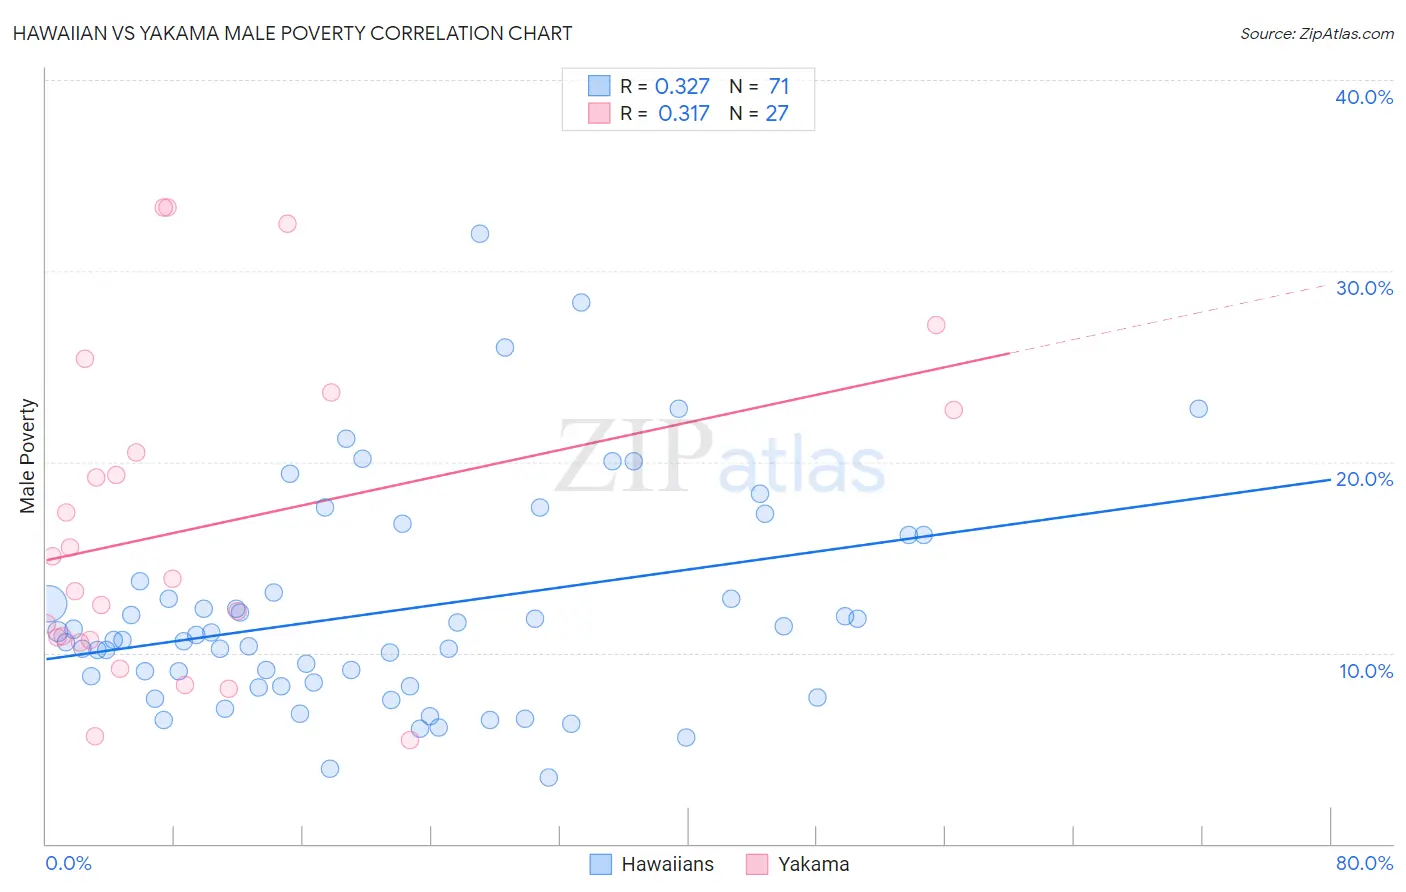
Hawaiian vs Yakama Male Poverty Correlation Chart
The statistical analysis conducted on geographies consisting of 327,329,663 people shows a mild positive correlation between the proportion of Hawaiians and poverty level among males in the United States with a correlation coefficient (R) of 0.327 and weighted average of 11.4%. Similarly, the statistical analysis conducted on geographies consisting of 19,917,879 people shows a mild positive correlation between the proportion of Yakama and poverty level among males in the United States with a correlation coefficient (R) of 0.317 and weighted average of 15.3%, a difference of 33.7%.
Male Poverty Correlation Summary
| Measurement | Hawaiian | Yakama |
| Minimum | 3.5% | 5.5% |
| Maximum | 31.9% | 33.3% |
| Range | 28.5% | 27.9% |
| Mean | 12.2% | 16.6% |
| Median | 10.7% | 13.8% |
| Interquartile 25% (IQ1) | 8.3% | 10.7% |
| Interquartile 75% (IQ3) | 13.7% | 22.7% |
| Interquartile Range (IQR) | 5.4% | 12.1% |
| Standard Deviation (Sample) | 5.7% | 8.3% |
| Standard Deviation (Population) | 5.7% | 8.1% |
Similar Demographics by Male Poverty
Demographics Similar to Hawaiians by Male Poverty
In terms of male poverty, the demographic groups most similar to Hawaiians are Sierra Leonean (11.4%, a difference of 0.18%), Israeli (11.5%, a difference of 0.26%), Immigrants from Iraq (11.4%, a difference of 0.41%), Immigrants from Sierra Leone (11.4%, a difference of 0.52%), and Immigrants from Afghanistan (11.4%, a difference of 0.57%).
| Demographics | Rating | Rank | Male Poverty |
| Mongolians | 39.0 /100 | #182 | Fair 11.3% |
| Kenyans | 38.4 /100 | #183 | Fair 11.3% |
| Immigrants | South America | 36.9 /100 | #184 | Fair 11.3% |
| Immigrants | Afghanistan | 33.3 /100 | #185 | Fair 11.4% |
| Immigrants | Sierra Leone | 32.9 /100 | #186 | Fair 11.4% |
| Immigrants | Iraq | 31.9 /100 | #187 | Fair 11.4% |
| Sierra Leoneans | 29.9 /100 | #188 | Fair 11.4% |
| Hawaiians | 28.3 /100 | #189 | Fair 11.4% |
| Israelis | 26.1 /100 | #190 | Fair 11.5% |
| South American Indians | 22.8 /100 | #191 | Fair 11.5% |
| Immigrants | Uruguay | 19.1 /100 | #192 | Poor 11.6% |
| Immigrants | Kuwait | 17.3 /100 | #193 | Poor 11.6% |
| Immigrants | Kenya | 16.1 /100 | #194 | Poor 11.6% |
| Arabs | 15.8 /100 | #195 | Poor 11.6% |
| Hmong | 15.8 /100 | #196 | Poor 11.6% |
Demographics Similar to Yakama by Male Poverty
In terms of male poverty, the demographic groups most similar to Yakama are Central American Indian (15.3%, a difference of 0.11%), Menominee (15.3%, a difference of 0.18%), Colville (15.2%, a difference of 0.37%), Kiowa (15.2%, a difference of 0.76%), and Arapaho (15.1%, a difference of 1.5%).
| Demographics | Rating | Rank | Male Poverty |
| Immigrants | Grenada | 0.0 /100 | #318 | Tragic 14.7% |
| U.S. Virgin Islanders | 0.0 /100 | #319 | Tragic 14.7% |
| Immigrants | Congo | 0.0 /100 | #320 | Tragic 14.7% |
| Arapaho | 0.0 /100 | #321 | Tragic 15.1% |
| Kiowa | 0.0 /100 | #322 | Tragic 15.2% |
| Colville | 0.0 /100 | #323 | Tragic 15.2% |
| Menominee | 0.0 /100 | #324 | Tragic 15.3% |
| Yakama | 0.0 /100 | #325 | Tragic 15.3% |
| Central American Indians | 0.0 /100 | #326 | Tragic 15.3% |
| Paiute | 0.0 /100 | #327 | Tragic 15.8% |
| Blacks/African Americans | 0.0 /100 | #328 | Tragic 15.8% |
| Dominicans | 0.0 /100 | #329 | Tragic 16.1% |
| Immigrants | Dominican Republic | 0.0 /100 | #330 | Tragic 16.2% |
| Ute | 0.0 /100 | #331 | Tragic 16.2% |
| Houma | 0.0 /100 | #332 | Tragic 16.7% |