Immigrants from Uganda vs Yakama Male Poverty
COMPARE
Immigrants from Uganda
Yakama
Male Poverty
Male Poverty Comparison
Immigrants from Uganda
Yakama
11.8%
MALE POVERTY
8.5/ 100
METRIC RATING
204th/ 347
METRIC RANK
15.3%
MALE POVERTY
0.0/ 100
METRIC RATING
325th/ 347
METRIC RANK
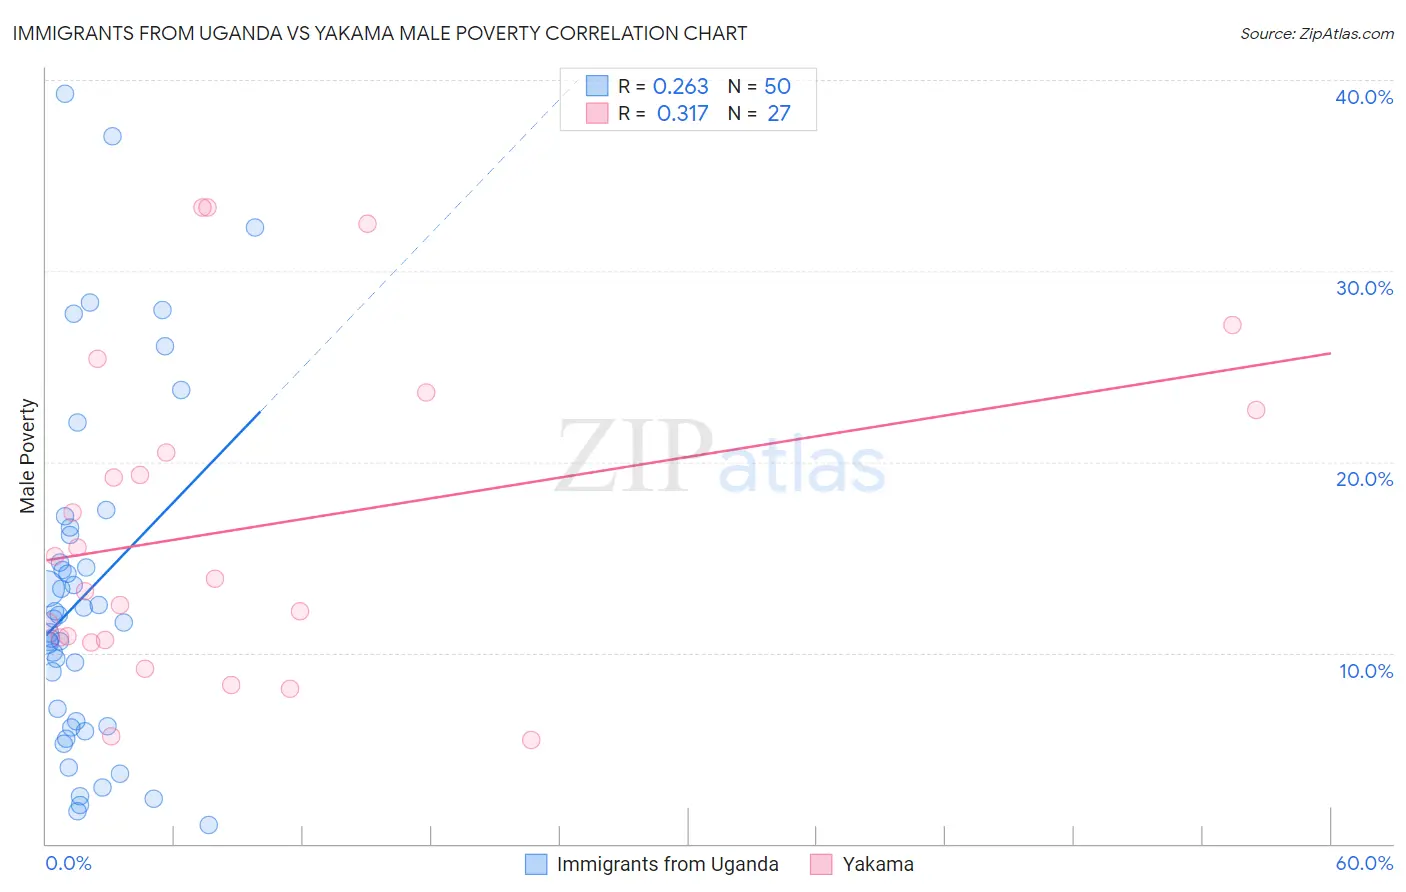
Immigrants from Uganda vs Yakama Male Poverty Correlation Chart
The statistical analysis conducted on geographies consisting of 125,960,451 people shows a weak positive correlation between the proportion of Immigrants from Uganda and poverty level among males in the United States with a correlation coefficient (R) of 0.263 and weighted average of 11.8%. Similarly, the statistical analysis conducted on geographies consisting of 19,917,879 people shows a mild positive correlation between the proportion of Yakama and poverty level among males in the United States with a correlation coefficient (R) of 0.317 and weighted average of 15.3%, a difference of 29.3%.
Male Poverty Correlation Summary
| Measurement | Immigrants from Uganda | Yakama |
| Minimum | 0.96% | 5.5% |
| Maximum | 39.3% | 33.3% |
| Range | 38.3% | 27.9% |
| Mean | 13.1% | 16.6% |
| Median | 11.7% | 13.8% |
| Interquartile 25% (IQ1) | 6.2% | 10.7% |
| Interquartile 75% (IQ3) | 16.2% | 22.7% |
| Interquartile Range (IQR) | 10.0% | 12.1% |
| Standard Deviation (Sample) | 9.1% | 8.3% |
| Standard Deviation (Population) | 9.0% | 8.1% |
Similar Demographics by Male Poverty
Demographics Similar to Immigrants from Uganda by Male Poverty
In terms of male poverty, the demographic groups most similar to Immigrants from Uganda are Immigrants from Western Asia (11.8%, a difference of 0.36%), Aleut (11.8%, a difference of 0.50%), Panamanian (11.9%, a difference of 0.78%), Immigrants from Eastern Africa (12.0%, a difference of 1.1%), and Spaniard (11.7%, a difference of 1.2%).
| Demographics | Rating | Rank | Male Poverty |
| Delaware | 15.4 /100 | #197 | Poor 11.7% |
| Iraqis | 14.7 /100 | #198 | Poor 11.7% |
| Spanish | 14.1 /100 | #199 | Poor 11.7% |
| Immigrants | Lebanon | 13.6 /100 | #200 | Poor 11.7% |
| Spaniards | 13.5 /100 | #201 | Poor 11.7% |
| Aleuts | 10.4 /100 | #202 | Poor 11.8% |
| Immigrants | Western Asia | 9.8 /100 | #203 | Tragic 11.8% |
| Immigrants | Uganda | 8.5 /100 | #204 | Tragic 11.8% |
| Panamanians | 6.2 /100 | #205 | Tragic 11.9% |
| Immigrants | Eastern Africa | 5.4 /100 | #206 | Tragic 12.0% |
| Malaysians | 5.2 /100 | #207 | Tragic 12.0% |
| Immigrants | Immigrants | 4.5 /100 | #208 | Tragic 12.0% |
| Immigrants | Azores | 4.3 /100 | #209 | Tragic 12.0% |
| Moroccans | 4.2 /100 | #210 | Tragic 12.0% |
| Immigrants | Panama | 4.0 /100 | #211 | Tragic 12.1% |
Demographics Similar to Yakama by Male Poverty
In terms of male poverty, the demographic groups most similar to Yakama are Central American Indian (15.3%, a difference of 0.11%), Menominee (15.3%, a difference of 0.18%), Colville (15.2%, a difference of 0.37%), Kiowa (15.2%, a difference of 0.76%), and Arapaho (15.1%, a difference of 1.5%).
| Demographics | Rating | Rank | Male Poverty |
| Immigrants | Grenada | 0.0 /100 | #318 | Tragic 14.7% |
| U.S. Virgin Islanders | 0.0 /100 | #319 | Tragic 14.7% |
| Immigrants | Congo | 0.0 /100 | #320 | Tragic 14.7% |
| Arapaho | 0.0 /100 | #321 | Tragic 15.1% |
| Kiowa | 0.0 /100 | #322 | Tragic 15.2% |
| Colville | 0.0 /100 | #323 | Tragic 15.2% |
| Menominee | 0.0 /100 | #324 | Tragic 15.3% |
| Yakama | 0.0 /100 | #325 | Tragic 15.3% |
| Central American Indians | 0.0 /100 | #326 | Tragic 15.3% |
| Paiute | 0.0 /100 | #327 | Tragic 15.8% |
| Blacks/African Americans | 0.0 /100 | #328 | Tragic 15.8% |
| Dominicans | 0.0 /100 | #329 | Tragic 16.1% |
| Immigrants | Dominican Republic | 0.0 /100 | #330 | Tragic 16.2% |
| Ute | 0.0 /100 | #331 | Tragic 16.2% |
| Houma | 0.0 /100 | #332 | Tragic 16.7% |