Afghan vs Yakama Male Poverty
COMPARE
Afghan
Yakama
Male Poverty
Male Poverty Comparison
Afghans
Yakama
10.9%
MALE POVERTY
71.9/ 100
METRIC RATING
143rd/ 347
METRIC RANK
15.3%
MALE POVERTY
0.0/ 100
METRIC RATING
325th/ 347
METRIC RANK
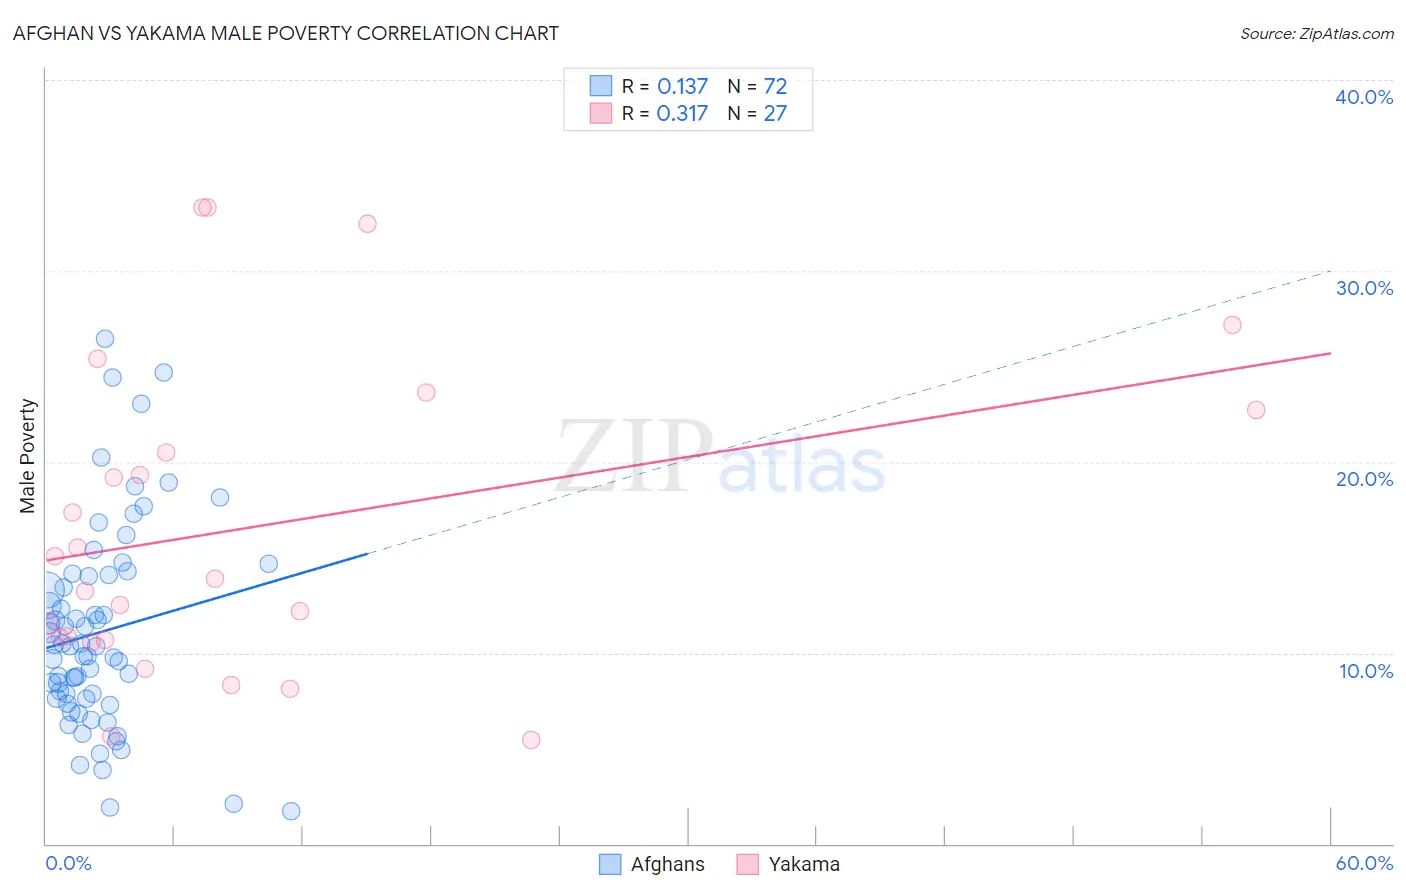
Afghan vs Yakama Male Poverty Correlation Chart
The statistical analysis conducted on geographies consisting of 148,780,421 people shows a poor positive correlation between the proportion of Afghans and poverty level among males in the United States with a correlation coefficient (R) of 0.137 and weighted average of 10.9%. Similarly, the statistical analysis conducted on geographies consisting of 19,917,879 people shows a mild positive correlation between the proportion of Yakama and poverty level among males in the United States with a correlation coefficient (R) of 0.317 and weighted average of 15.3%, a difference of 40.0%.
Male Poverty Correlation Summary
| Measurement | Afghan | Yakama |
| Minimum | 1.7% | 5.5% |
| Maximum | 26.4% | 33.3% |
| Range | 24.7% | 27.9% |
| Mean | 11.1% | 16.6% |
| Median | 10.4% | 13.8% |
| Interquartile 25% (IQ1) | 7.6% | 10.7% |
| Interquartile 75% (IQ3) | 14.0% | 22.7% |
| Interquartile Range (IQR) | 6.4% | 12.1% |
| Standard Deviation (Sample) | 5.3% | 8.3% |
| Standard Deviation (Population) | 5.3% | 8.1% |
Similar Demographics by Male Poverty
Demographics Similar to Afghans by Male Poverty
In terms of male poverty, the demographic groups most similar to Afghans are Samoan (10.9%, a difference of 0.020%), Immigrants from Germany (10.9%, a difference of 0.040%), Syrian (10.9%, a difference of 0.070%), Basque (10.9%, a difference of 0.34%), and Icelander (11.0%, a difference of 0.41%).
| Demographics | Rating | Rank | Male Poverty |
| Immigrants | Israel | 80.9 /100 | #136 | Excellent 10.8% |
| Immigrants | Switzerland | 79.2 /100 | #137 | Good 10.8% |
| Yugoslavians | 78.2 /100 | #138 | Good 10.8% |
| Immigrants | Jordan | 77.5 /100 | #139 | Good 10.8% |
| Tlingit-Haida | 76.1 /100 | #140 | Good 10.9% |
| Immigrants | France | 75.8 /100 | #141 | Good 10.9% |
| Basques | 74.6 /100 | #142 | Good 10.9% |
| Afghans | 71.9 /100 | #143 | Good 10.9% |
| Samoans | 71.8 /100 | #144 | Good 10.9% |
| Immigrants | Germany | 71.6 /100 | #145 | Good 10.9% |
| Syrians | 71.4 /100 | #146 | Good 10.9% |
| Icelanders | 68.5 /100 | #147 | Good 11.0% |
| Armenians | 68.0 /100 | #148 | Good 11.0% |
| Immigrants | Venezuela | 67.9 /100 | #149 | Good 11.0% |
| Guamanians/Chamorros | 67.6 /100 | #150 | Good 11.0% |
Demographics Similar to Yakama by Male Poverty
In terms of male poverty, the demographic groups most similar to Yakama are Central American Indian (15.3%, a difference of 0.11%), Menominee (15.3%, a difference of 0.18%), Colville (15.2%, a difference of 0.37%), Kiowa (15.2%, a difference of 0.76%), and Arapaho (15.1%, a difference of 1.5%).
| Demographics | Rating | Rank | Male Poverty |
| Immigrants | Grenada | 0.0 /100 | #318 | Tragic 14.7% |
| U.S. Virgin Islanders | 0.0 /100 | #319 | Tragic 14.7% |
| Immigrants | Congo | 0.0 /100 | #320 | Tragic 14.7% |
| Arapaho | 0.0 /100 | #321 | Tragic 15.1% |
| Kiowa | 0.0 /100 | #322 | Tragic 15.2% |
| Colville | 0.0 /100 | #323 | Tragic 15.2% |
| Menominee | 0.0 /100 | #324 | Tragic 15.3% |
| Yakama | 0.0 /100 | #325 | Tragic 15.3% |
| Central American Indians | 0.0 /100 | #326 | Tragic 15.3% |
| Paiute | 0.0 /100 | #327 | Tragic 15.8% |
| Blacks/African Americans | 0.0 /100 | #328 | Tragic 15.8% |
| Dominicans | 0.0 /100 | #329 | Tragic 16.1% |
| Immigrants | Dominican Republic | 0.0 /100 | #330 | Tragic 16.2% |
| Ute | 0.0 /100 | #331 | Tragic 16.2% |
| Houma | 0.0 /100 | #332 | Tragic 16.7% |