Senegalese vs Soviet Union Births to Unmarried Women
COMPARE
Senegalese
Soviet Union
Births to Unmarried Women
Births to Unmarried Women Comparison
Senegalese
Soviet Union
36.8%
BIRTHS TO UNMARRIED WOMEN
0.1/ 100
METRIC RATING
269th/ 347
METRIC RANK
26.3%
BIRTHS TO UNMARRIED WOMEN
99.9/ 100
METRIC RATING
21st/ 347
METRIC RANK
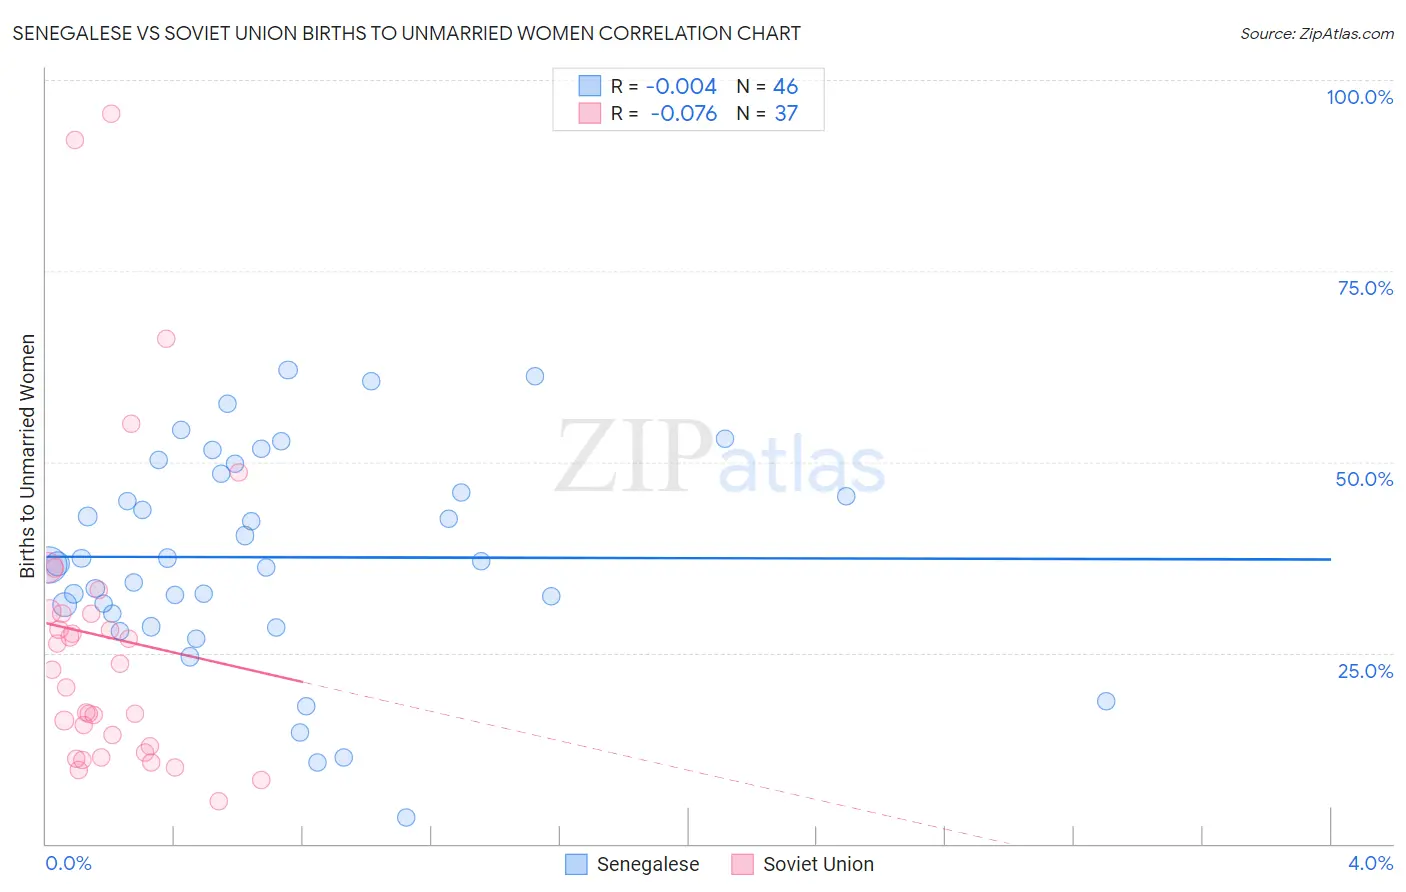
Senegalese vs Soviet Union Births to Unmarried Women Correlation Chart
The statistical analysis conducted on geographies consisting of 77,154,598 people shows no correlation between the proportion of Senegalese and percentage of births to unmarried women in the United States with a correlation coefficient (R) of -0.004 and weighted average of 36.8%. Similarly, the statistical analysis conducted on geographies consisting of 42,942,883 people shows a slight negative correlation between the proportion of Soviet Union and percentage of births to unmarried women in the United States with a correlation coefficient (R) of -0.076 and weighted average of 26.3%, a difference of 39.8%.
Births to Unmarried Women Correlation Summary
| Measurement | Senegalese | Soviet Union |
| Minimum | 3.4% | 5.5% |
| Maximum | 62.0% | 95.6% |
| Range | 58.6% | 90.1% |
| Mean | 37.5% | 27.0% |
| Median | 36.8% | 22.8% |
| Interquartile 25% (IQ1) | 30.1% | 12.3% |
| Interquartile 75% (IQ3) | 48.4% | 30.3% |
| Interquartile Range (IQR) | 18.3% | 18.0% |
| Standard Deviation (Sample) | 13.8% | 20.9% |
| Standard Deviation (Population) | 13.7% | 20.6% |
Similar Demographics by Births to Unmarried Women
Demographics Similar to Senegalese by Births to Unmarried Women
In terms of births to unmarried women, the demographic groups most similar to Senegalese are Immigrants from Congo (36.8%, a difference of 0.080%), Immigrants from Barbados (36.8%, a difference of 0.10%), Comanche (36.7%, a difference of 0.12%), Central American (36.7%, a difference of 0.13%), and Immigrants from Senegal (36.7%, a difference of 0.20%).
| Demographics | Rating | Rank | Births to Unmarried Women |
| French American Indians | 0.1 /100 | #262 | Tragic 36.6% |
| Nicaraguans | 0.1 /100 | #263 | Tragic 36.6% |
| Sub-Saharan Africans | 0.1 /100 | #264 | Tragic 36.7% |
| Cherokee | 0.1 /100 | #265 | Tragic 36.7% |
| Immigrants | Senegal | 0.1 /100 | #266 | Tragic 36.7% |
| Central Americans | 0.1 /100 | #267 | Tragic 36.7% |
| Comanche | 0.1 /100 | #268 | Tragic 36.7% |
| Senegalese | 0.1 /100 | #269 | Tragic 36.8% |
| Immigrants | Congo | 0.1 /100 | #270 | Tragic 36.8% |
| Immigrants | Barbados | 0.1 /100 | #271 | Tragic 36.8% |
| Choctaw | 0.1 /100 | #272 | Tragic 36.9% |
| Mexicans | 0.1 /100 | #273 | Tragic 36.9% |
| Cree | 0.1 /100 | #274 | Tragic 37.0% |
| Barbadians | 0.1 /100 | #275 | Tragic 37.0% |
| Belizeans | 0.1 /100 | #276 | Tragic 37.0% |
Demographics Similar to Soviet Union by Births to Unmarried Women
In terms of births to unmarried women, the demographic groups most similar to Soviet Union are Immigrants from Korea (26.3%, a difference of 0.13%), Burmese (26.4%, a difference of 0.22%), Armenian (26.2%, a difference of 0.35%), Immigrants from Japan (26.4%, a difference of 0.41%), and Immigrants from Armenia (26.1%, a difference of 0.93%).
| Demographics | Rating | Rank | Births to Unmarried Women |
| Immigrants | Lebanon | 100.0 /100 | #14 | Exceptional 25.3% |
| Immigrants | Singapore | 100.0 /100 | #15 | Exceptional 25.6% |
| Immigrants | Belarus | 100.0 /100 | #16 | Exceptional 25.6% |
| Immigrants | Uzbekistan | 100.0 /100 | #17 | Exceptional 25.8% |
| Immigrants | Armenia | 99.9 /100 | #18 | Exceptional 26.1% |
| Armenians | 99.9 /100 | #19 | Exceptional 26.2% |
| Immigrants | Korea | 99.9 /100 | #20 | Exceptional 26.3% |
| Soviet Union | 99.9 /100 | #21 | Exceptional 26.3% |
| Burmese | 99.9 /100 | #22 | Exceptional 26.4% |
| Immigrants | Japan | 99.9 /100 | #23 | Exceptional 26.4% |
| Immigrants | Australia | 99.9 /100 | #24 | Exceptional 26.6% |
| Cambodians | 99.9 /100 | #25 | Exceptional 26.7% |
| Asians | 99.9 /100 | #26 | Exceptional 26.8% |
| Immigrants | Asia | 99.9 /100 | #27 | Exceptional 26.8% |
| Okinawans | 99.8 /100 | #28 | Exceptional 26.9% |