Marshallese vs Soviet Union Male Poverty
COMPARE
Marshallese
Soviet Union
Male Poverty
Male Poverty Comparison
Marshallese
Soviet Union
12.5%
MALE POVERTY
0.8/ 100
METRIC RATING
230th/ 347
METRIC RANK
11.1%
MALE POVERTY
60.3/ 100
METRIC RATING
160th/ 347
METRIC RANK
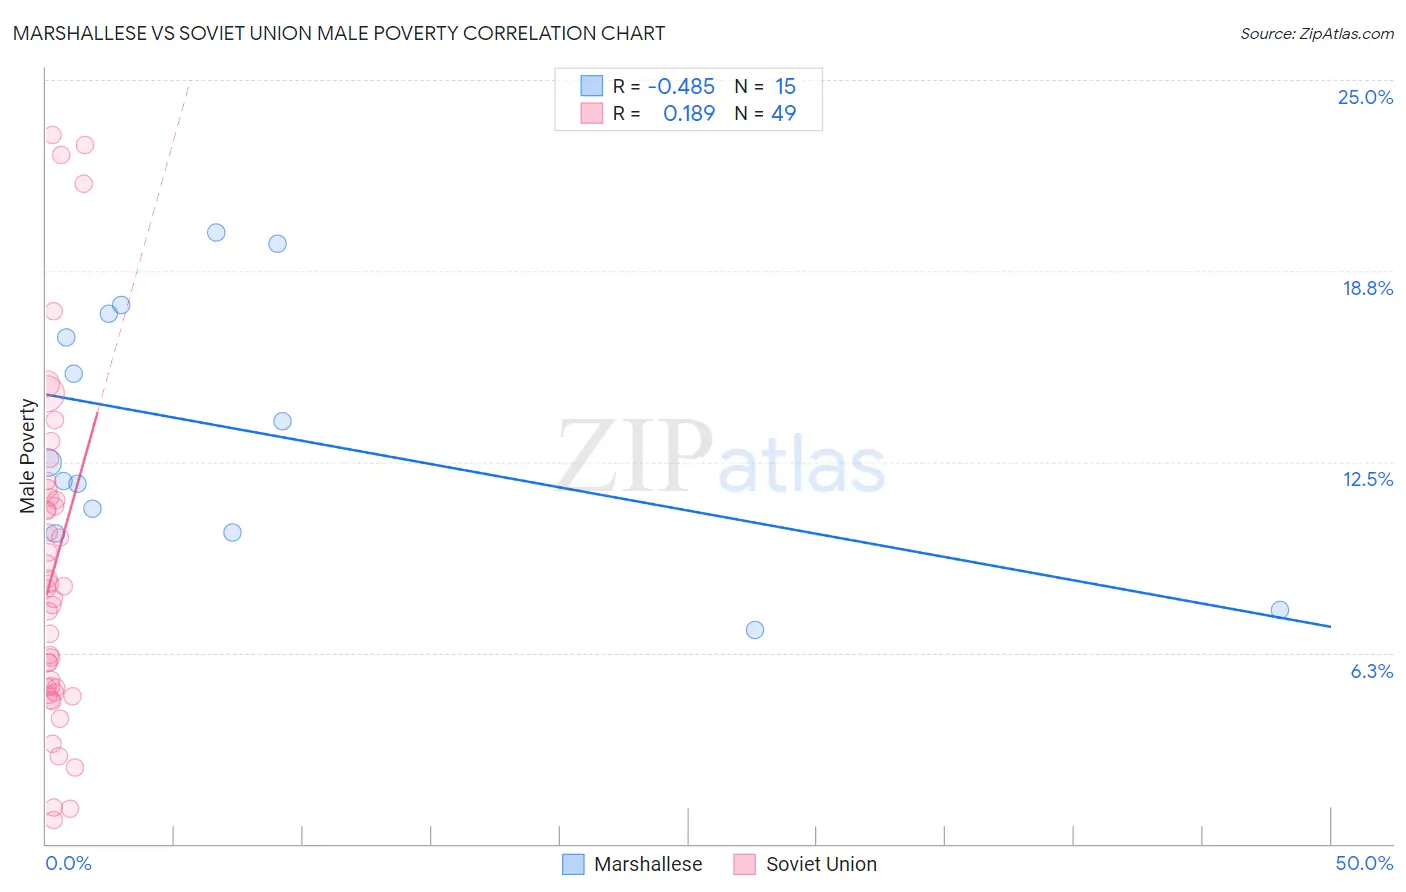
Marshallese vs Soviet Union Male Poverty Correlation Chart
The statistical analysis conducted on geographies consisting of 14,760,991 people shows a moderate negative correlation between the proportion of Marshallese and poverty level among males in the United States with a correlation coefficient (R) of -0.485 and weighted average of 12.5%. Similarly, the statistical analysis conducted on geographies consisting of 43,503,005 people shows a poor positive correlation between the proportion of Soviet Union and poverty level among males in the United States with a correlation coefficient (R) of 0.189 and weighted average of 11.1%, a difference of 12.9%.
Male Poverty Correlation Summary
| Measurement | Marshallese | Soviet Union |
| Minimum | 7.0% | 0.80% |
| Maximum | 20.0% | 23.2% |
| Range | 13.0% | 22.4% |
| Mean | 13.5% | 9.1% |
| Median | 12.5% | 8.4% |
| Interquartile 25% (IQ1) | 10.2% | 5.0% |
| Interquartile 75% (IQ3) | 17.3% | 11.5% |
| Interquartile Range (IQR) | 7.2% | 6.4% |
| Standard Deviation (Sample) | 4.1% | 5.6% |
| Standard Deviation (Population) | 4.0% | 5.5% |
Similar Demographics by Male Poverty
Demographics Similar to Marshallese by Male Poverty
In terms of male poverty, the demographic groups most similar to Marshallese are Salvadoran (12.6%, a difference of 0.56%), Nicaraguan (12.6%, a difference of 0.68%), Fijian (12.6%, a difference of 0.72%), Immigrants from Armenia (12.6%, a difference of 0.79%), and Cuban (12.4%, a difference of 0.98%).
| Demographics | Rating | Rank | Male Poverty |
| Immigrants | Micronesia | 2.1 /100 | #223 | Tragic 12.2% |
| Immigrants | Nigeria | 1.6 /100 | #224 | Tragic 12.3% |
| Osage | 1.5 /100 | #225 | Tragic 12.3% |
| Nigerians | 1.4 /100 | #226 | Tragic 12.3% |
| Alaska Natives | 1.4 /100 | #227 | Tragic 12.4% |
| Alsatians | 1.3 /100 | #228 | Tragic 12.4% |
| Cubans | 1.3 /100 | #229 | Tragic 12.4% |
| Marshallese | 0.8 /100 | #230 | Tragic 12.5% |
| Salvadorans | 0.6 /100 | #231 | Tragic 12.6% |
| Nicaraguans | 0.6 /100 | #232 | Tragic 12.6% |
| Fijians | 0.6 /100 | #233 | Tragic 12.6% |
| Immigrants | Armenia | 0.6 /100 | #234 | Tragic 12.6% |
| Immigrants | Laos | 0.5 /100 | #235 | Tragic 12.6% |
| Immigrants | Saudi Arabia | 0.4 /100 | #236 | Tragic 12.7% |
| French American Indians | 0.4 /100 | #237 | Tragic 12.7% |
Demographics Similar to Soviet Union by Male Poverty
In terms of male poverty, the demographic groups most similar to Soviet Union are Immigrants from Northern Africa (11.1%, a difference of 0.070%), Taiwanese (11.0%, a difference of 0.25%), Colombian (11.0%, a difference of 0.28%), Immigrants from Chile (11.1%, a difference of 0.30%), and Scotch-Irish (11.0%, a difference of 0.35%).
| Demographics | Rating | Rank | Male Poverty |
| Immigrants | Bosnia and Herzegovina | 65.2 /100 | #153 | Good 11.0% |
| Immigrants | Kazakhstan | 64.8 /100 | #154 | Good 11.0% |
| Immigrants | Malaysia | 64.7 /100 | #155 | Good 11.0% |
| Costa Ricans | 63.9 /100 | #156 | Good 11.0% |
| Scotch-Irish | 63.7 /100 | #157 | Good 11.0% |
| Colombians | 63.0 /100 | #158 | Good 11.0% |
| Taiwanese | 62.7 /100 | #159 | Good 11.0% |
| Soviet Union | 60.3 /100 | #160 | Good 11.1% |
| Immigrants | Northern Africa | 59.7 /100 | #161 | Average 11.1% |
| Immigrants | Chile | 57.4 /100 | #162 | Average 11.1% |
| Whites/Caucasians | 56.7 /100 | #163 | Average 11.1% |
| Ethiopians | 56.7 /100 | #164 | Average 11.1% |
| Immigrants | Spain | 55.5 /100 | #165 | Average 11.1% |
| Immigrants | Albania | 55.3 /100 | #166 | Average 11.1% |
| Hungarians | 55.1 /100 | #167 | Average 11.1% |