Seminole vs Immigrants from Caribbean Single Mother Poverty
COMPARE
Seminole
Immigrants from Caribbean
Single Mother Poverty
Single Mother Poverty Comparison
Seminole
Immigrants from Caribbean
35.8%
SINGLE MOTHER POVERTY
0.0/ 100
METRIC RATING
326th/ 347
METRIC RANK
31.1%
SINGLE MOTHER POVERTY
0.4/ 100
METRIC RATING
258th/ 347
METRIC RANK
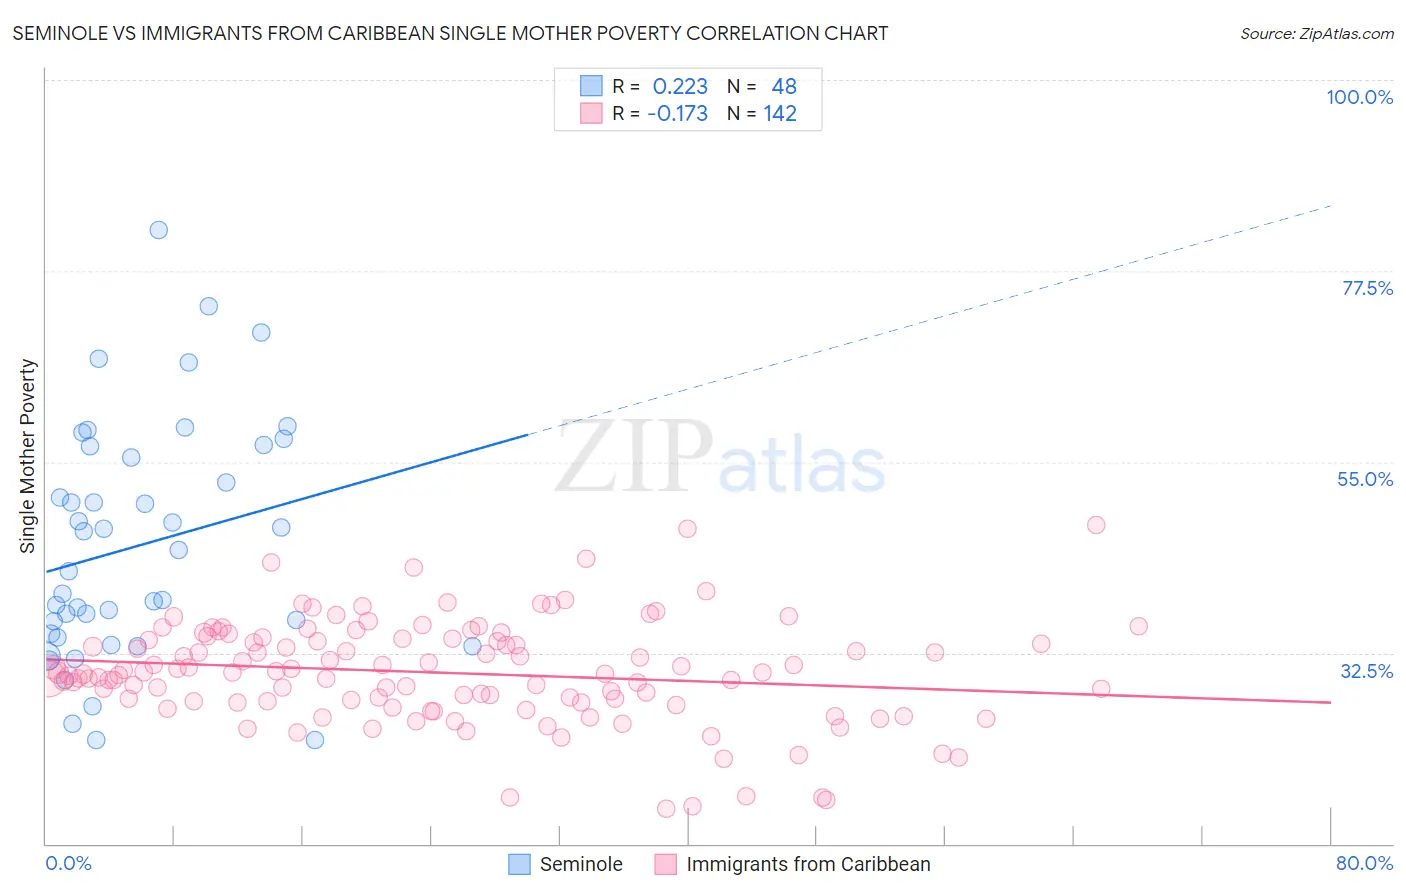
Seminole vs Immigrants from Caribbean Single Mother Poverty Correlation Chart
The statistical analysis conducted on geographies consisting of 117,787,190 people shows a weak positive correlation between the proportion of Seminole and poverty level among single mothers in the United States with a correlation coefficient (R) of 0.223 and weighted average of 35.8%. Similarly, the statistical analysis conducted on geographies consisting of 437,361,394 people shows a poor negative correlation between the proportion of Immigrants from Caribbean and poverty level among single mothers in the United States with a correlation coefficient (R) of -0.173 and weighted average of 31.1%, a difference of 15.1%.
Single Mother Poverty Correlation Summary
| Measurement | Seminole | Immigrants from Caribbean |
| Minimum | 22.2% | 14.1% |
| Maximum | 82.4% | 47.6% |
| Range | 60.1% | 33.5% |
| Mean | 45.1% | 30.2% |
| Median | 43.4% | 30.1% |
| Interquartile 25% (IQ1) | 34.6% | 26.7% |
| Interquartile 75% (IQ3) | 56.2% | 34.2% |
| Interquartile Range (IQR) | 21.6% | 7.4% |
| Standard Deviation (Sample) | 13.9% | 6.1% |
| Standard Deviation (Population) | 13.8% | 6.0% |
Similar Demographics by Single Mother Poverty
Demographics Similar to Seminole by Single Mother Poverty
In terms of single mother poverty, the demographic groups most similar to Seminole are Ute (35.7%, a difference of 0.30%), Ottawa (35.5%, a difference of 0.78%), Kiowa (35.5%, a difference of 0.99%), Yakama (36.4%, a difference of 1.6%), and Choctaw (36.4%, a difference of 1.7%).
| Demographics | Rating | Rank | Single Mother Poverty |
| Chippewa | 0.0 /100 | #319 | Tragic 34.8% |
| Iroquois | 0.0 /100 | #320 | Tragic 34.8% |
| Paiute | 0.0 /100 | #321 | Tragic 35.1% |
| Blacks/African Americans | 0.0 /100 | #322 | Tragic 35.2% |
| Kiowa | 0.0 /100 | #323 | Tragic 35.5% |
| Ottawa | 0.0 /100 | #324 | Tragic 35.5% |
| Ute | 0.0 /100 | #325 | Tragic 35.7% |
| Seminole | 0.0 /100 | #326 | Tragic 35.8% |
| Yakama | 0.0 /100 | #327 | Tragic 36.4% |
| Choctaw | 0.0 /100 | #328 | Tragic 36.4% |
| Apache | 0.0 /100 | #329 | Tragic 36.6% |
| Natives/Alaskans | 0.0 /100 | #330 | Tragic 36.6% |
| Creek | 0.0 /100 | #331 | Tragic 36.7% |
| Dutch West Indians | 0.0 /100 | #332 | Tragic 36.8% |
| Menominee | 0.0 /100 | #333 | Tragic 37.1% |
Demographics Similar to Immigrants from Caribbean by Single Mother Poverty
In terms of single mother poverty, the demographic groups most similar to Immigrants from Caribbean are Immigrants from Bangladesh (31.1%, a difference of 0.030%), Immigrants from Bahamas (31.1%, a difference of 0.090%), Immigrants from West Indies (31.1%, a difference of 0.13%), White/Caucasian (31.2%, a difference of 0.19%), and Immigrants from El Salvador (31.2%, a difference of 0.27%).
| Demographics | Rating | Rank | Single Mother Poverty |
| Tlingit-Haida | 0.6 /100 | #251 | Tragic 30.9% |
| Alaska Natives | 0.6 /100 | #252 | Tragic 30.9% |
| Celtics | 0.6 /100 | #253 | Tragic 30.9% |
| Senegalese | 0.5 /100 | #254 | Tragic 31.0% |
| Belizeans | 0.5 /100 | #255 | Tragic 31.0% |
| Immigrants | West Indies | 0.4 /100 | #256 | Tragic 31.1% |
| Immigrants | Bahamas | 0.4 /100 | #257 | Tragic 31.1% |
| Immigrants | Caribbean | 0.4 /100 | #258 | Tragic 31.1% |
| Immigrants | Bangladesh | 0.4 /100 | #259 | Tragic 31.1% |
| Whites/Caucasians | 0.3 /100 | #260 | Tragic 31.2% |
| Immigrants | El Salvador | 0.3 /100 | #261 | Tragic 31.2% |
| Hmong | 0.3 /100 | #262 | Tragic 31.2% |
| Bahamians | 0.2 /100 | #263 | Tragic 31.3% |
| Immigrants | Ecuador | 0.2 /100 | #264 | Tragic 31.3% |
| German Russians | 0.2 /100 | #265 | Tragic 31.3% |