Venezuelan vs Immigrants from Caribbean Single Mother Poverty
COMPARE
Venezuelan
Immigrants from Caribbean
Single Mother Poverty
Single Mother Poverty Comparison
Venezuelans
Immigrants from Caribbean
28.2%
SINGLE MOTHER POVERTY
94.5/ 100
METRIC RATING
111th/ 347
METRIC RANK
31.1%
SINGLE MOTHER POVERTY
0.4/ 100
METRIC RATING
258th/ 347
METRIC RANK
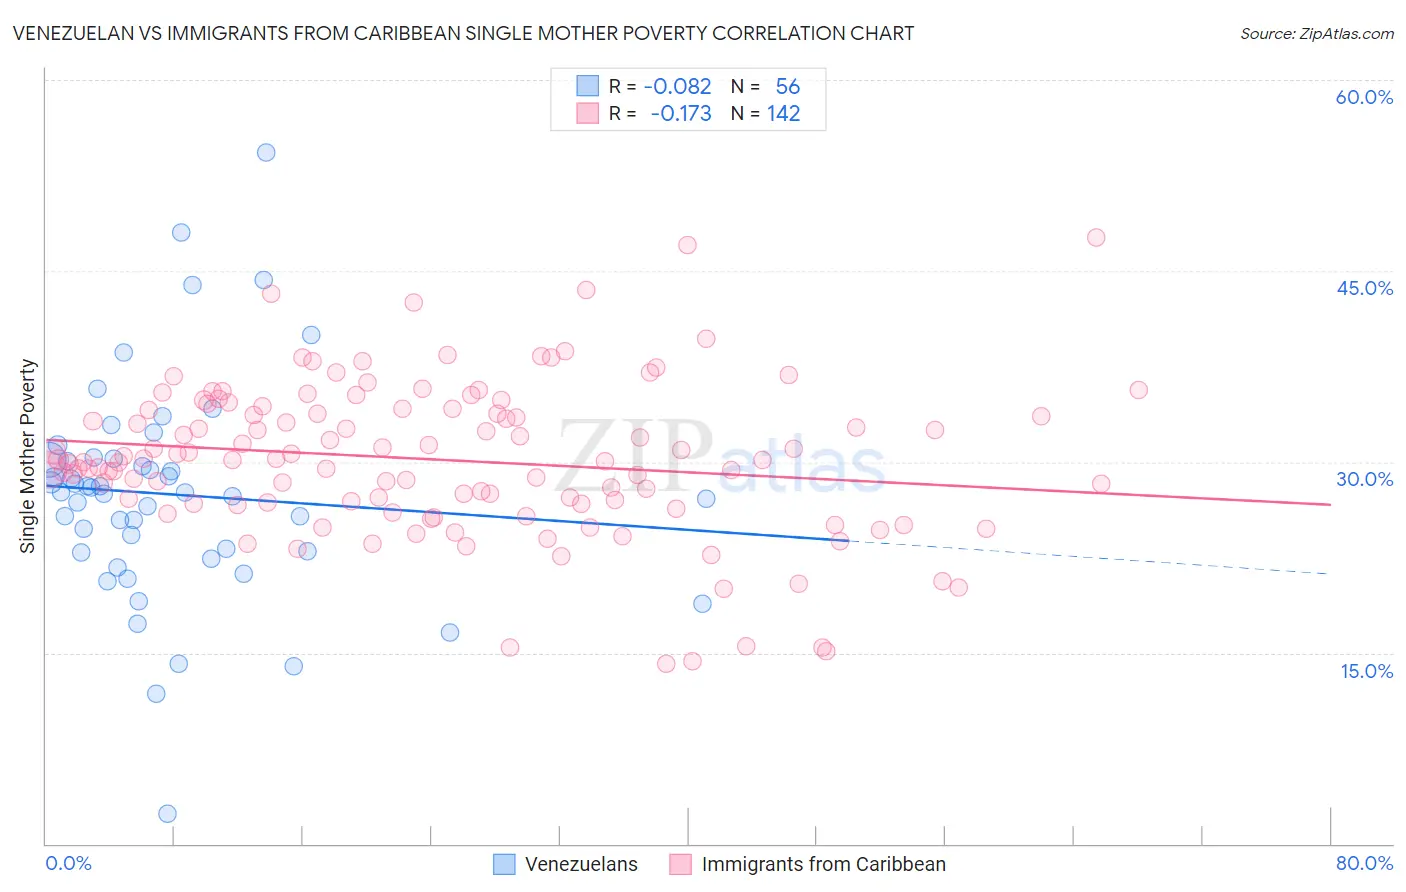
Venezuelan vs Immigrants from Caribbean Single Mother Poverty Correlation Chart
The statistical analysis conducted on geographies consisting of 301,183,109 people shows a slight negative correlation between the proportion of Venezuelans and poverty level among single mothers in the United States with a correlation coefficient (R) of -0.082 and weighted average of 28.2%. Similarly, the statistical analysis conducted on geographies consisting of 437,361,394 people shows a poor negative correlation between the proportion of Immigrants from Caribbean and poverty level among single mothers in the United States with a correlation coefficient (R) of -0.173 and weighted average of 31.1%, a difference of 10.5%.
Single Mother Poverty Correlation Summary
| Measurement | Venezuelan | Immigrants from Caribbean |
| Minimum | 2.4% | 14.1% |
| Maximum | 54.3% | 47.6% |
| Range | 51.9% | 33.5% |
| Mean | 27.4% | 30.2% |
| Median | 27.6% | 30.1% |
| Interquartile 25% (IQ1) | 22.9% | 26.7% |
| Interquartile 75% (IQ3) | 30.2% | 34.2% |
| Interquartile Range (IQR) | 7.3% | 7.4% |
| Standard Deviation (Sample) | 8.7% | 6.1% |
| Standard Deviation (Population) | 8.6% | 6.0% |
Similar Demographics by Single Mother Poverty
Demographics Similar to Venezuelans by Single Mother Poverty
In terms of single mother poverty, the demographic groups most similar to Venezuelans are Immigrants from Kazakhstan (28.2%, a difference of 0.010%), Croatian (28.2%, a difference of 0.050%), Immigrants from Armenia (28.1%, a difference of 0.17%), Immigrants from Zimbabwe (28.1%, a difference of 0.26%), and Immigrants from South Africa (28.3%, a difference of 0.29%).
| Demographics | Rating | Rank | Single Mother Poverty |
| Italians | 96.6 /100 | #104 | Exceptional 28.0% |
| Israelis | 96.5 /100 | #105 | Exceptional 28.0% |
| Ukrainians | 96.4 /100 | #106 | Exceptional 28.0% |
| Immigrants | Venezuela | 95.8 /100 | #107 | Exceptional 28.1% |
| Immigrants | Zimbabwe | 95.5 /100 | #108 | Exceptional 28.1% |
| Immigrants | Armenia | 95.2 /100 | #109 | Exceptional 28.1% |
| Croatians | 94.8 /100 | #110 | Exceptional 28.2% |
| Venezuelans | 94.5 /100 | #111 | Exceptional 28.2% |
| Immigrants | Kazakhstan | 94.5 /100 | #112 | Exceptional 28.2% |
| Immigrants | South Africa | 93.2 /100 | #113 | Exceptional 28.3% |
| Immigrants | Western Asia | 92.7 /100 | #114 | Exceptional 28.3% |
| Immigrants | Kuwait | 92.7 /100 | #115 | Exceptional 28.3% |
| Immigrants | Uganda | 92.5 /100 | #116 | Exceptional 28.3% |
| Australians | 92.5 /100 | #117 | Exceptional 28.3% |
| Brazilians | 92.4 /100 | #118 | Exceptional 28.3% |
Demographics Similar to Immigrants from Caribbean by Single Mother Poverty
In terms of single mother poverty, the demographic groups most similar to Immigrants from Caribbean are Immigrants from Bangladesh (31.1%, a difference of 0.030%), Immigrants from Bahamas (31.1%, a difference of 0.090%), Immigrants from West Indies (31.1%, a difference of 0.13%), White/Caucasian (31.2%, a difference of 0.19%), and Immigrants from El Salvador (31.2%, a difference of 0.27%).
| Demographics | Rating | Rank | Single Mother Poverty |
| Tlingit-Haida | 0.6 /100 | #251 | Tragic 30.9% |
| Alaska Natives | 0.6 /100 | #252 | Tragic 30.9% |
| Celtics | 0.6 /100 | #253 | Tragic 30.9% |
| Senegalese | 0.5 /100 | #254 | Tragic 31.0% |
| Belizeans | 0.5 /100 | #255 | Tragic 31.0% |
| Immigrants | West Indies | 0.4 /100 | #256 | Tragic 31.1% |
| Immigrants | Bahamas | 0.4 /100 | #257 | Tragic 31.1% |
| Immigrants | Caribbean | 0.4 /100 | #258 | Tragic 31.1% |
| Immigrants | Bangladesh | 0.4 /100 | #259 | Tragic 31.1% |
| Whites/Caucasians | 0.3 /100 | #260 | Tragic 31.2% |
| Immigrants | El Salvador | 0.3 /100 | #261 | Tragic 31.2% |
| Hmong | 0.3 /100 | #262 | Tragic 31.2% |
| Bahamians | 0.2 /100 | #263 | Tragic 31.3% |
| Immigrants | Ecuador | 0.2 /100 | #264 | Tragic 31.3% |
| German Russians | 0.2 /100 | #265 | Tragic 31.3% |