Immigrants vs Immigrants from Caribbean Single Mother Poverty
COMPARE
Immigrants
Immigrants from Caribbean
Single Mother Poverty
Single Mother Poverty Comparison
Immigrants
Immigrants from Caribbean
29.7%
SINGLE MOTHER POVERTY
16.6/ 100
METRIC RATING
204th/ 347
METRIC RANK
31.1%
SINGLE MOTHER POVERTY
0.4/ 100
METRIC RATING
258th/ 347
METRIC RANK
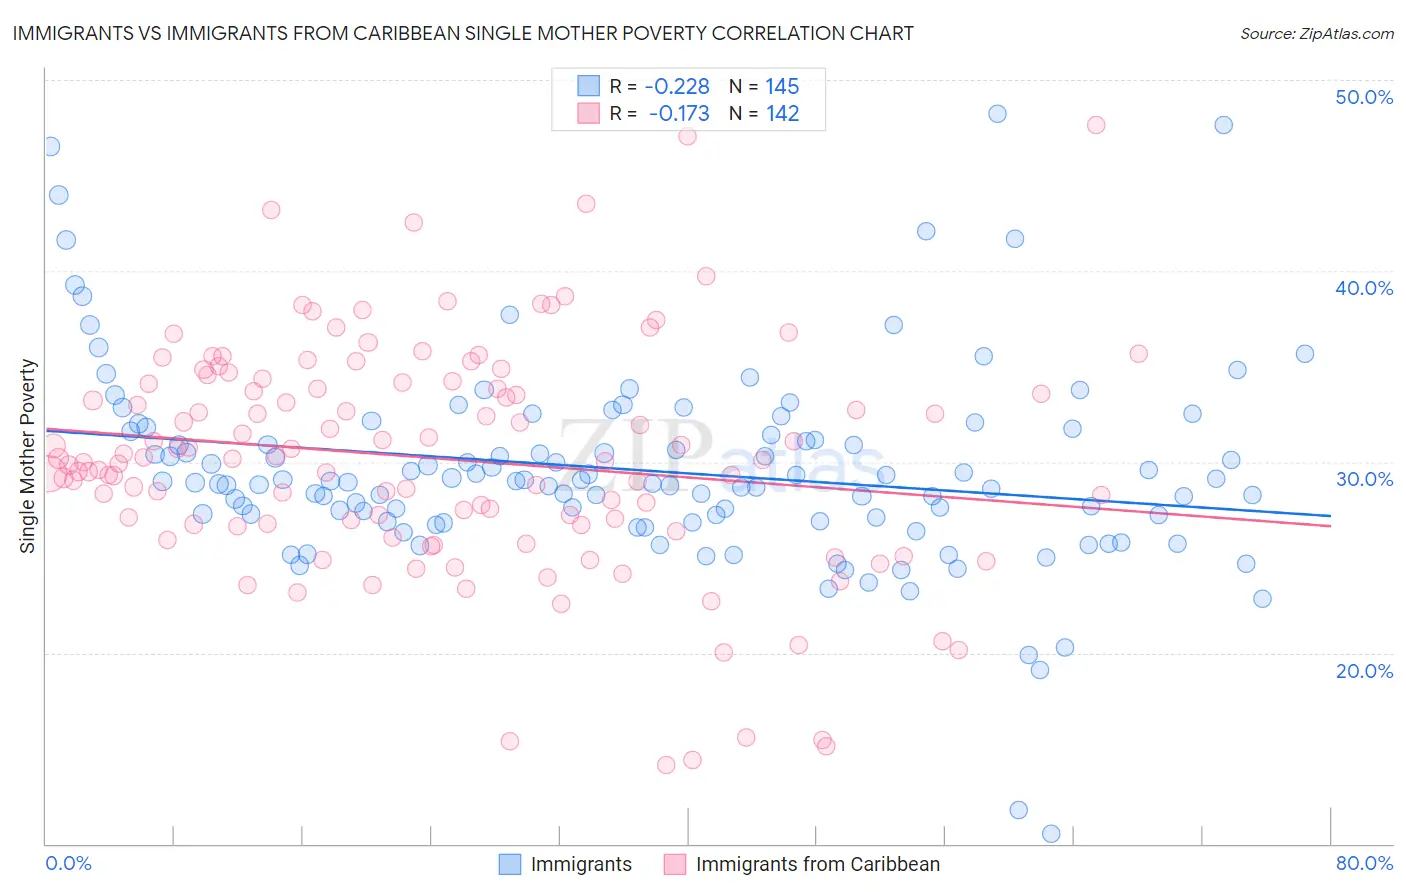
Immigrants vs Immigrants from Caribbean Single Mother Poverty Correlation Chart
The statistical analysis conducted on geographies consisting of 548,894,561 people shows a weak negative correlation between the proportion of Immigrants and poverty level among single mothers in the United States with a correlation coefficient (R) of -0.228 and weighted average of 29.7%. Similarly, the statistical analysis conducted on geographies consisting of 437,361,394 people shows a poor negative correlation between the proportion of Immigrants from Caribbean and poverty level among single mothers in the United States with a correlation coefficient (R) of -0.173 and weighted average of 31.1%, a difference of 4.7%.
Single Mother Poverty Correlation Summary
| Measurement | Immigrants | Immigrants from Caribbean |
| Minimum | 10.6% | 14.1% |
| Maximum | 48.3% | 47.6% |
| Range | 37.7% | 33.5% |
| Mean | 29.6% | 30.2% |
| Median | 29.0% | 30.1% |
| Interquartile 25% (IQ1) | 27.0% | 26.7% |
| Interquartile 75% (IQ3) | 31.7% | 34.2% |
| Interquartile Range (IQR) | 4.7% | 7.4% |
| Standard Deviation (Sample) | 5.3% | 6.1% |
| Standard Deviation (Population) | 5.3% | 6.0% |
Similar Demographics by Single Mother Poverty
Demographics Similar to Immigrants by Single Mother Poverty
In terms of single mother poverty, the demographic groups most similar to Immigrants are Czechoslovakian (29.7%, a difference of 0.040%), Swiss (29.7%, a difference of 0.050%), Immigrants from Haiti (29.7%, a difference of 0.060%), Malaysian (29.7%, a difference of 0.070%), and Immigrants from Panama (29.8%, a difference of 0.090%).
| Demographics | Rating | Rank | Single Mother Poverty |
| Immigrants | Jamaica | 22.0 /100 | #197 | Fair 29.6% |
| Trinidadians and Tobagonians | 21.7 /100 | #198 | Fair 29.6% |
| Cubans | 20.8 /100 | #199 | Fair 29.6% |
| Panamanians | 20.0 /100 | #200 | Fair 29.6% |
| Belgians | 18.8 /100 | #201 | Poor 29.7% |
| Malaysians | 17.4 /100 | #202 | Poor 29.7% |
| Swiss | 17.2 /100 | #203 | Poor 29.7% |
| Immigrants | Immigrants | 16.6 /100 | #204 | Poor 29.7% |
| Czechoslovakians | 16.1 /100 | #205 | Poor 29.7% |
| Immigrants | Haiti | 15.8 /100 | #206 | Poor 29.7% |
| Immigrants | Panama | 15.5 /100 | #207 | Poor 29.8% |
| Immigrants | Guyana | 14.7 /100 | #208 | Poor 29.8% |
| Irish | 13.9 /100 | #209 | Poor 29.8% |
| Haitians | 13.3 /100 | #210 | Poor 29.8% |
| Guyanese | 12.8 /100 | #211 | Poor 29.8% |
Demographics Similar to Immigrants from Caribbean by Single Mother Poverty
In terms of single mother poverty, the demographic groups most similar to Immigrants from Caribbean are Immigrants from Bangladesh (31.1%, a difference of 0.030%), Immigrants from Bahamas (31.1%, a difference of 0.090%), Immigrants from West Indies (31.1%, a difference of 0.13%), White/Caucasian (31.2%, a difference of 0.19%), and Immigrants from El Salvador (31.2%, a difference of 0.27%).
| Demographics | Rating | Rank | Single Mother Poverty |
| Tlingit-Haida | 0.6 /100 | #251 | Tragic 30.9% |
| Alaska Natives | 0.6 /100 | #252 | Tragic 30.9% |
| Celtics | 0.6 /100 | #253 | Tragic 30.9% |
| Senegalese | 0.5 /100 | #254 | Tragic 31.0% |
| Belizeans | 0.5 /100 | #255 | Tragic 31.0% |
| Immigrants | West Indies | 0.4 /100 | #256 | Tragic 31.1% |
| Immigrants | Bahamas | 0.4 /100 | #257 | Tragic 31.1% |
| Immigrants | Caribbean | 0.4 /100 | #258 | Tragic 31.1% |
| Immigrants | Bangladesh | 0.4 /100 | #259 | Tragic 31.1% |
| Whites/Caucasians | 0.3 /100 | #260 | Tragic 31.2% |
| Immigrants | El Salvador | 0.3 /100 | #261 | Tragic 31.2% |
| Hmong | 0.3 /100 | #262 | Tragic 31.2% |
| Bahamians | 0.2 /100 | #263 | Tragic 31.3% |
| Immigrants | Ecuador | 0.2 /100 | #264 | Tragic 31.3% |
| German Russians | 0.2 /100 | #265 | Tragic 31.3% |