Hawaiian vs Immigrants from Caribbean Single Mother Poverty
COMPARE
Hawaiian
Immigrants from Caribbean
Single Mother Poverty
Single Mother Poverty Comparison
Hawaiians
Immigrants from Caribbean
29.2%
SINGLE MOTHER POVERTY
47.8/ 100
METRIC RATING
176th/ 347
METRIC RANK
31.1%
SINGLE MOTHER POVERTY
0.4/ 100
METRIC RATING
258th/ 347
METRIC RANK
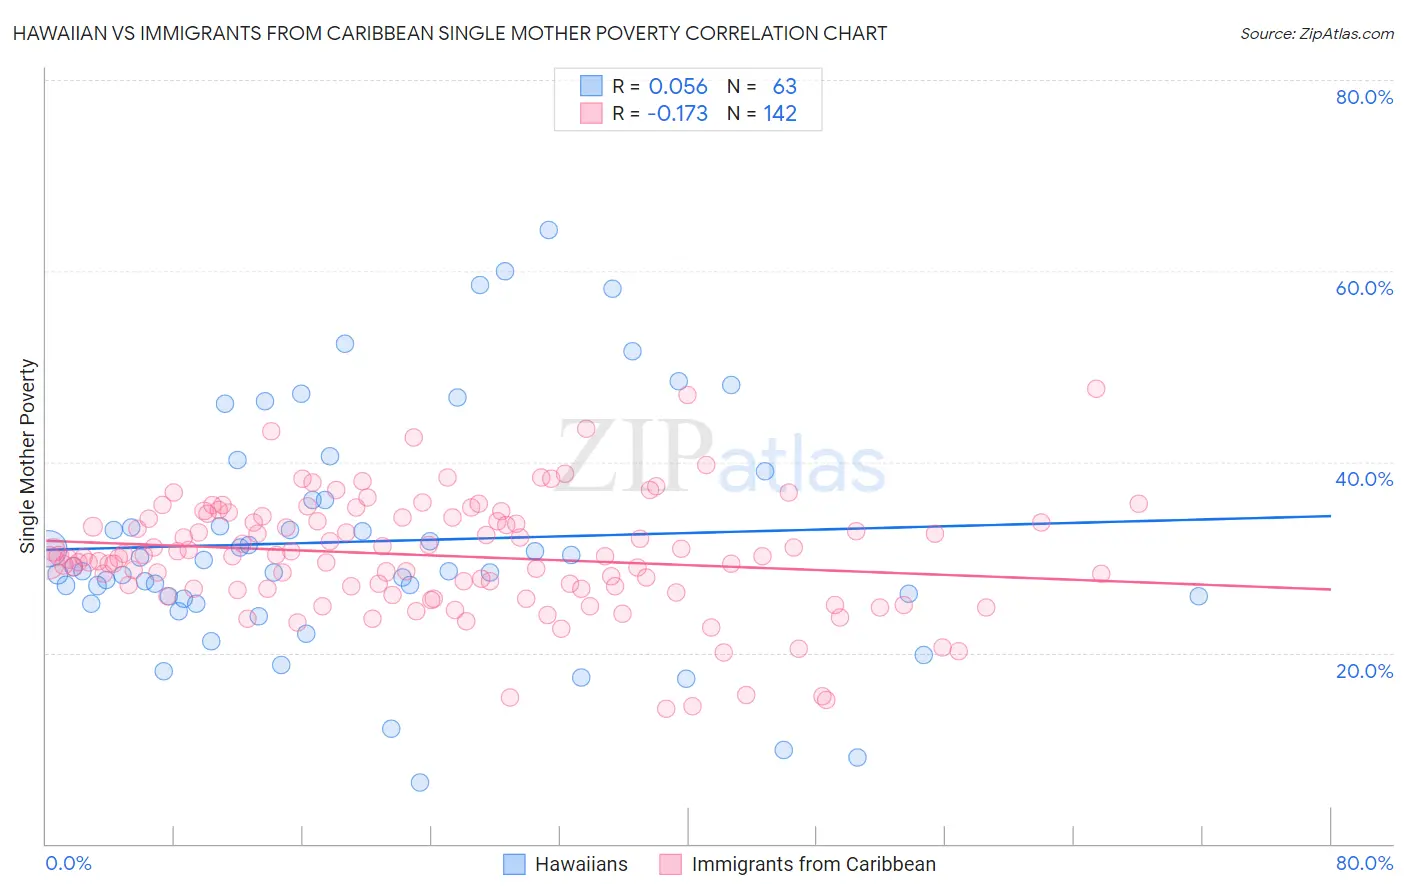
Hawaiian vs Immigrants from Caribbean Single Mother Poverty Correlation Chart
The statistical analysis conducted on geographies consisting of 322,664,662 people shows a slight positive correlation between the proportion of Hawaiians and poverty level among single mothers in the United States with a correlation coefficient (R) of 0.056 and weighted average of 29.2%. Similarly, the statistical analysis conducted on geographies consisting of 437,361,394 people shows a poor negative correlation between the proportion of Immigrants from Caribbean and poverty level among single mothers in the United States with a correlation coefficient (R) of -0.173 and weighted average of 31.1%, a difference of 6.6%.
Single Mother Poverty Correlation Summary
| Measurement | Hawaiian | Immigrants from Caribbean |
| Minimum | 6.4% | 14.1% |
| Maximum | 64.3% | 47.6% |
| Range | 57.9% | 33.5% |
| Mean | 31.7% | 30.2% |
| Median | 28.6% | 30.1% |
| Interquartile 25% (IQ1) | 25.7% | 26.7% |
| Interquartile 75% (IQ3) | 36.0% | 34.2% |
| Interquartile Range (IQR) | 10.3% | 7.4% |
| Standard Deviation (Sample) | 12.4% | 6.1% |
| Standard Deviation (Population) | 12.3% | 6.0% |
Similar Demographics by Single Mother Poverty
Demographics Similar to Hawaiians by Single Mother Poverty
In terms of single mother poverty, the demographic groups most similar to Hawaiians are Immigrants from Costa Rica (29.2%, a difference of 0.040%), Immigrants from Saudi Arabia (29.2%, a difference of 0.10%), British (29.2%, a difference of 0.13%), Immigrants from Bosnia and Herzegovina (29.2%, a difference of 0.13%), and South American Indian (29.3%, a difference of 0.22%).
| Demographics | Rating | Rank | Single Mother Poverty |
| Immigrants | Uruguay | 57.2 /100 | #169 | Average 29.1% |
| New Zealanders | 55.1 /100 | #170 | Average 29.1% |
| Puget Sound Salish | 55.1 /100 | #171 | Average 29.1% |
| Carpatho Rusyns | 53.8 /100 | #172 | Average 29.1% |
| British | 50.6 /100 | #173 | Average 29.2% |
| Immigrants | Saudi Arabia | 50.0 /100 | #174 | Average 29.2% |
| Immigrants | Costa Rica | 48.8 /100 | #175 | Average 29.2% |
| Hawaiians | 47.8 /100 | #176 | Average 29.2% |
| Immigrants | Bosnia and Herzegovina | 45.1 /100 | #177 | Average 29.2% |
| South American Indians | 43.2 /100 | #178 | Average 29.3% |
| Immigrants | Uzbekistan | 42.6 /100 | #179 | Average 29.3% |
| Immigrants | Norway | 41.5 /100 | #180 | Average 29.3% |
| Canadians | 40.4 /100 | #181 | Average 29.3% |
| Immigrants | Eastern Africa | 38.5 /100 | #182 | Fair 29.3% |
| Nepalese | 38.3 /100 | #183 | Fair 29.3% |
Demographics Similar to Immigrants from Caribbean by Single Mother Poverty
In terms of single mother poverty, the demographic groups most similar to Immigrants from Caribbean are Immigrants from Bangladesh (31.1%, a difference of 0.030%), Immigrants from Bahamas (31.1%, a difference of 0.090%), Immigrants from West Indies (31.1%, a difference of 0.13%), White/Caucasian (31.2%, a difference of 0.19%), and Immigrants from El Salvador (31.2%, a difference of 0.27%).
| Demographics | Rating | Rank | Single Mother Poverty |
| Tlingit-Haida | 0.6 /100 | #251 | Tragic 30.9% |
| Alaska Natives | 0.6 /100 | #252 | Tragic 30.9% |
| Celtics | 0.6 /100 | #253 | Tragic 30.9% |
| Senegalese | 0.5 /100 | #254 | Tragic 31.0% |
| Belizeans | 0.5 /100 | #255 | Tragic 31.0% |
| Immigrants | West Indies | 0.4 /100 | #256 | Tragic 31.1% |
| Immigrants | Bahamas | 0.4 /100 | #257 | Tragic 31.1% |
| Immigrants | Caribbean | 0.4 /100 | #258 | Tragic 31.1% |
| Immigrants | Bangladesh | 0.4 /100 | #259 | Tragic 31.1% |
| Whites/Caucasians | 0.3 /100 | #260 | Tragic 31.2% |
| Immigrants | El Salvador | 0.3 /100 | #261 | Tragic 31.2% |
| Hmong | 0.3 /100 | #262 | Tragic 31.2% |
| Bahamians | 0.2 /100 | #263 | Tragic 31.3% |
| Immigrants | Ecuador | 0.2 /100 | #264 | Tragic 31.3% |
| German Russians | 0.2 /100 | #265 | Tragic 31.3% |