Seminole vs Immigrants from Belarus Single Mother Poverty
COMPARE
Seminole
Immigrants from Belarus
Single Mother Poverty
Single Mother Poverty Comparison
Seminole
Immigrants from Belarus
35.8%
SINGLE MOTHER POVERTY
0.0/ 100
METRIC RATING
326th/ 347
METRIC RANK
27.4%
SINGLE MOTHER POVERTY
99.4/ 100
METRIC RATING
70th/ 347
METRIC RANK
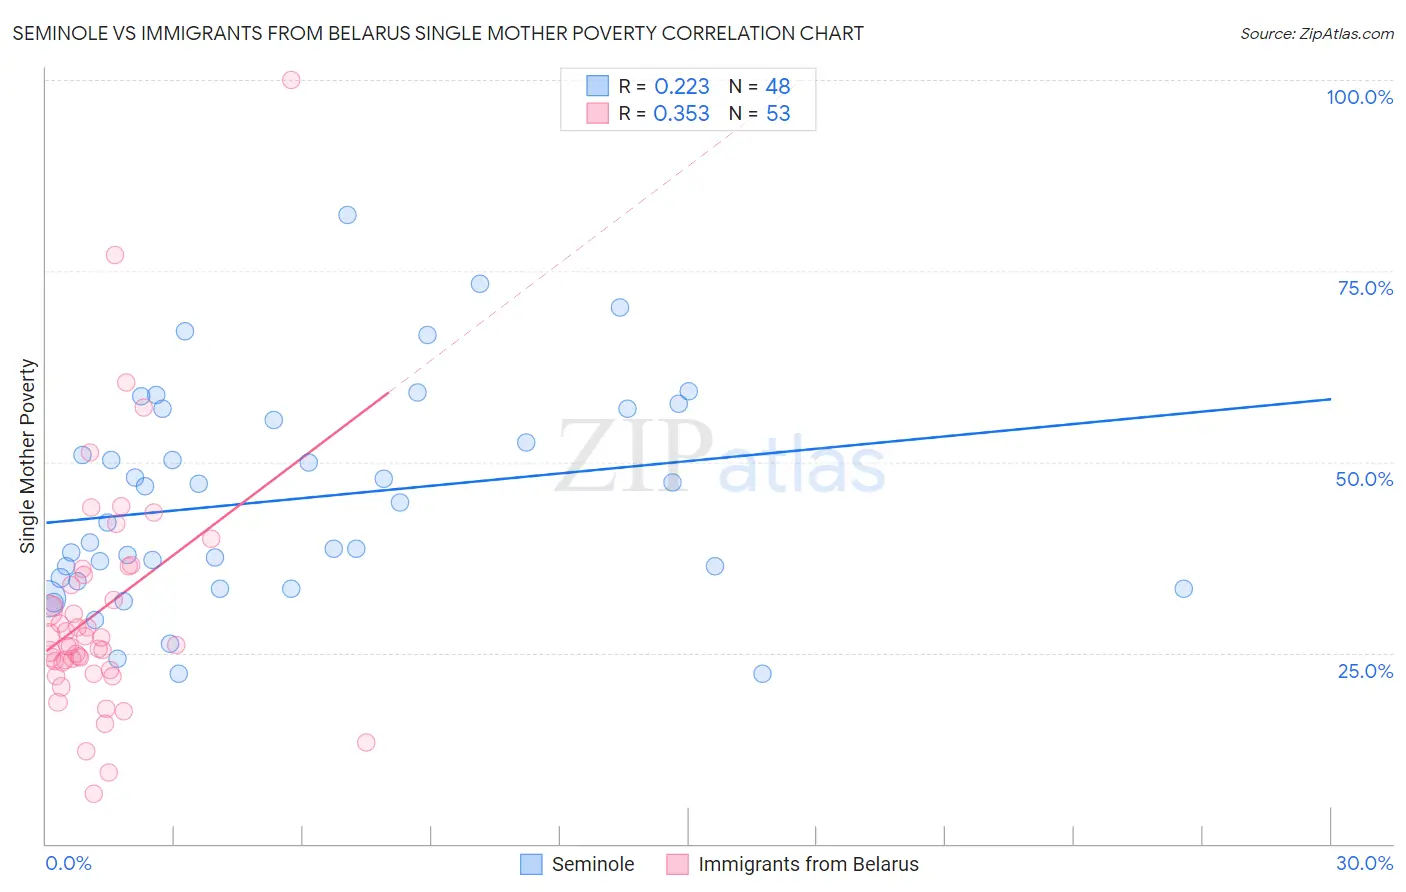
Seminole vs Immigrants from Belarus Single Mother Poverty Correlation Chart
The statistical analysis conducted on geographies consisting of 117,787,190 people shows a weak positive correlation between the proportion of Seminole and poverty level among single mothers in the United States with a correlation coefficient (R) of 0.223 and weighted average of 35.8%. Similarly, the statistical analysis conducted on geographies consisting of 148,206,459 people shows a mild positive correlation between the proportion of Immigrants from Belarus and poverty level among single mothers in the United States with a correlation coefficient (R) of 0.353 and weighted average of 27.4%, a difference of 30.7%.
Single Mother Poverty Correlation Summary
| Measurement | Seminole | Immigrants from Belarus |
| Minimum | 22.2% | 6.6% |
| Maximum | 82.4% | 100.0% |
| Range | 60.1% | 93.4% |
| Mean | 45.1% | 30.6% |
| Median | 43.4% | 26.1% |
| Interquartile 25% (IQ1) | 34.6% | 23.2% |
| Interquartile 75% (IQ3) | 56.2% | 35.6% |
| Interquartile Range (IQR) | 21.6% | 12.4% |
| Standard Deviation (Sample) | 13.9% | 15.9% |
| Standard Deviation (Population) | 13.8% | 15.8% |
Similar Demographics by Single Mother Poverty
Demographics Similar to Seminole by Single Mother Poverty
In terms of single mother poverty, the demographic groups most similar to Seminole are Ute (35.7%, a difference of 0.30%), Ottawa (35.5%, a difference of 0.78%), Kiowa (35.5%, a difference of 0.99%), Yakama (36.4%, a difference of 1.6%), and Choctaw (36.4%, a difference of 1.7%).
| Demographics | Rating | Rank | Single Mother Poverty |
| Chippewa | 0.0 /100 | #319 | Tragic 34.8% |
| Iroquois | 0.0 /100 | #320 | Tragic 34.8% |
| Paiute | 0.0 /100 | #321 | Tragic 35.1% |
| Blacks/African Americans | 0.0 /100 | #322 | Tragic 35.2% |
| Kiowa | 0.0 /100 | #323 | Tragic 35.5% |
| Ottawa | 0.0 /100 | #324 | Tragic 35.5% |
| Ute | 0.0 /100 | #325 | Tragic 35.7% |
| Seminole | 0.0 /100 | #326 | Tragic 35.8% |
| Yakama | 0.0 /100 | #327 | Tragic 36.4% |
| Choctaw | 0.0 /100 | #328 | Tragic 36.4% |
| Apache | 0.0 /100 | #329 | Tragic 36.6% |
| Natives/Alaskans | 0.0 /100 | #330 | Tragic 36.6% |
| Creek | 0.0 /100 | #331 | Tragic 36.7% |
| Dutch West Indians | 0.0 /100 | #332 | Tragic 36.8% |
| Menominee | 0.0 /100 | #333 | Tragic 37.1% |
Demographics Similar to Immigrants from Belarus by Single Mother Poverty
In terms of single mother poverty, the demographic groups most similar to Immigrants from Belarus are Lithuanian (27.4%, a difference of 0.010%), Macedonian (27.4%, a difference of 0.020%), Immigrants from Russia (27.4%, a difference of 0.040%), Sierra Leonean (27.4%, a difference of 0.11%), and Immigrants from Czechoslovakia (27.4%, a difference of 0.17%).
| Demographics | Rating | Rank | Single Mother Poverty |
| Immigrants | Northern Europe | 99.5 /100 | #63 | Exceptional 27.3% |
| Russians | 99.5 /100 | #64 | Exceptional 27.3% |
| Immigrants | Turkey | 99.5 /100 | #65 | Exceptional 27.3% |
| Soviet Union | 99.5 /100 | #66 | Exceptional 27.3% |
| Immigrants | Australia | 99.5 /100 | #67 | Exceptional 27.3% |
| Immigrants | Czechoslovakia | 99.5 /100 | #68 | Exceptional 27.4% |
| Lithuanians | 99.4 /100 | #69 | Exceptional 27.4% |
| Immigrants | Belarus | 99.4 /100 | #70 | Exceptional 27.4% |
| Macedonians | 99.4 /100 | #71 | Exceptional 27.4% |
| Immigrants | Russia | 99.4 /100 | #72 | Exceptional 27.4% |
| Sierra Leoneans | 99.3 /100 | #73 | Exceptional 27.4% |
| Immigrants | Europe | 99.3 /100 | #74 | Exceptional 27.4% |
| Immigrants | Sweden | 99.2 /100 | #75 | Exceptional 27.5% |
| Peruvians | 99.2 /100 | #76 | Exceptional 27.5% |
| Immigrants | Peru | 99.2 /100 | #77 | Exceptional 27.5% |