Seminole vs Immigrants from England Single Mother Poverty
COMPARE
Seminole
Immigrants from England
Single Mother Poverty
Single Mother Poverty Comparison
Seminole
Immigrants from England
35.8%
SINGLE MOTHER POVERTY
0.0/ 100
METRIC RATING
326th/ 347
METRIC RANK
28.4%
SINGLE MOTHER POVERTY
90.5/ 100
METRIC RATING
128th/ 347
METRIC RANK
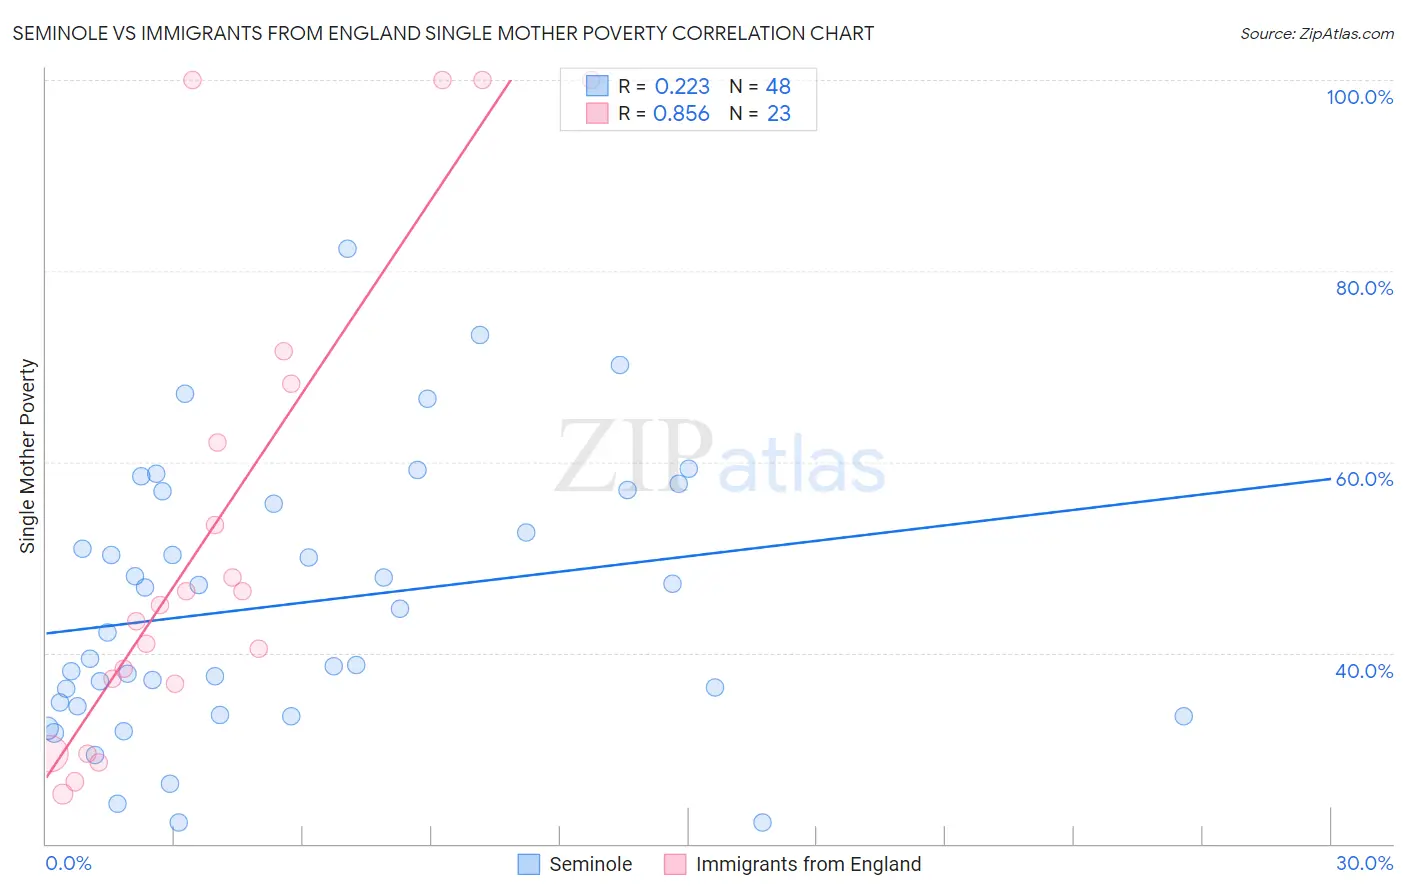
Seminole vs Immigrants from England Single Mother Poverty Correlation Chart
The statistical analysis conducted on geographies consisting of 117,787,190 people shows a weak positive correlation between the proportion of Seminole and poverty level among single mothers in the United States with a correlation coefficient (R) of 0.223 and weighted average of 35.8%. Similarly, the statistical analysis conducted on geographies consisting of 380,702,942 people shows a very strong positive correlation between the proportion of Immigrants from England and poverty level among single mothers in the United States with a correlation coefficient (R) of 0.856 and weighted average of 28.4%, a difference of 26.2%.
Single Mother Poverty Correlation Summary
| Measurement | Seminole | Immigrants from England |
| Minimum | 22.2% | 25.2% |
| Maximum | 82.4% | 100.0% |
| Range | 60.1% | 74.8% |
| Mean | 45.1% | 52.9% |
| Median | 43.4% | 45.0% |
| Interquartile 25% (IQ1) | 34.6% | 36.7% |
| Interquartile 75% (IQ3) | 56.2% | 68.2% |
| Interquartile Range (IQR) | 21.6% | 31.5% |
| Standard Deviation (Sample) | 13.9% | 25.2% |
| Standard Deviation (Population) | 13.8% | 24.7% |
Similar Demographics by Single Mother Poverty
Demographics Similar to Seminole by Single Mother Poverty
In terms of single mother poverty, the demographic groups most similar to Seminole are Ute (35.7%, a difference of 0.30%), Ottawa (35.5%, a difference of 0.78%), Kiowa (35.5%, a difference of 0.99%), Yakama (36.4%, a difference of 1.6%), and Choctaw (36.4%, a difference of 1.7%).
| Demographics | Rating | Rank | Single Mother Poverty |
| Chippewa | 0.0 /100 | #319 | Tragic 34.8% |
| Iroquois | 0.0 /100 | #320 | Tragic 34.8% |
| Paiute | 0.0 /100 | #321 | Tragic 35.1% |
| Blacks/African Americans | 0.0 /100 | #322 | Tragic 35.2% |
| Kiowa | 0.0 /100 | #323 | Tragic 35.5% |
| Ottawa | 0.0 /100 | #324 | Tragic 35.5% |
| Ute | 0.0 /100 | #325 | Tragic 35.7% |
| Seminole | 0.0 /100 | #326 | Tragic 35.8% |
| Yakama | 0.0 /100 | #327 | Tragic 36.4% |
| Choctaw | 0.0 /100 | #328 | Tragic 36.4% |
| Apache | 0.0 /100 | #329 | Tragic 36.6% |
| Natives/Alaskans | 0.0 /100 | #330 | Tragic 36.6% |
| Creek | 0.0 /100 | #331 | Tragic 36.7% |
| Dutch West Indians | 0.0 /100 | #332 | Tragic 36.8% |
| Menominee | 0.0 /100 | #333 | Tragic 37.1% |
Demographics Similar to Immigrants from England by Single Mother Poverty
In terms of single mother poverty, the demographic groups most similar to Immigrants from England are South American (28.4%, a difference of 0.020%), Polish (28.4%, a difference of 0.030%), Norwegian (28.4%, a difference of 0.030%), Immigrants from Chile (28.4%, a difference of 0.040%), and Immigrants from Austria (28.4%, a difference of 0.040%).
| Demographics | Rating | Rank | Single Mother Poverty |
| Immigrants | Afghanistan | 92.1 /100 | #121 | Exceptional 28.3% |
| Colombians | 91.8 /100 | #122 | Exceptional 28.3% |
| Uruguayans | 91.7 /100 | #123 | Exceptional 28.3% |
| Immigrants | Switzerland | 91.7 /100 | #124 | Exceptional 28.3% |
| Kenyans | 90.9 /100 | #125 | Exceptional 28.4% |
| Immigrants | Chile | 90.8 /100 | #126 | Exceptional 28.4% |
| Poles | 90.8 /100 | #127 | Exceptional 28.4% |
| Immigrants | England | 90.5 /100 | #128 | Exceptional 28.4% |
| South Americans | 90.4 /100 | #129 | Exceptional 28.4% |
| Norwegians | 90.4 /100 | #130 | Exceptional 28.4% |
| Immigrants | Austria | 90.3 /100 | #131 | Exceptional 28.4% |
| Immigrants | Morocco | 89.5 /100 | #132 | Excellent 28.4% |
| Swedes | 89.4 /100 | #133 | Excellent 28.4% |
| Immigrants | Southern Europe | 89.2 /100 | #134 | Excellent 28.4% |
| Immigrants | Spain | 89.2 /100 | #135 | Excellent 28.4% |