Liberian vs Immigrants from Caribbean Single Mother Poverty
COMPARE
Liberian
Immigrants from Caribbean
Single Mother Poverty
Single Mother Poverty Comparison
Liberians
Immigrants from Caribbean
29.9%
SINGLE MOTHER POVERTY
11.7/ 100
METRIC RATING
214th/ 347
METRIC RANK
31.1%
SINGLE MOTHER POVERTY
0.4/ 100
METRIC RATING
258th/ 347
METRIC RANK
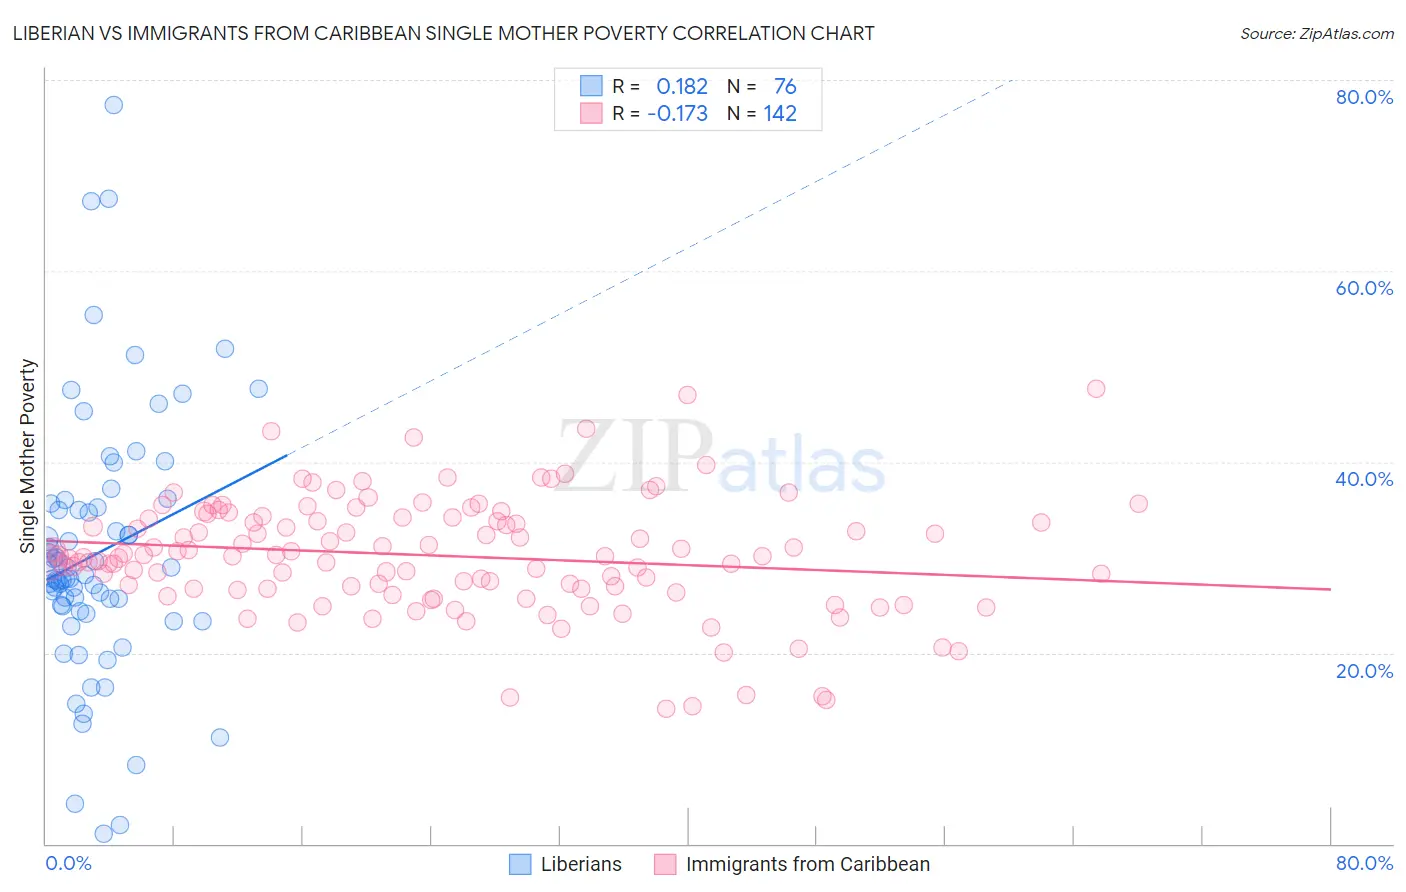
Liberian vs Immigrants from Caribbean Single Mother Poverty Correlation Chart
The statistical analysis conducted on geographies consisting of 117,524,642 people shows a poor positive correlation between the proportion of Liberians and poverty level among single mothers in the United States with a correlation coefficient (R) of 0.182 and weighted average of 29.9%. Similarly, the statistical analysis conducted on geographies consisting of 437,361,394 people shows a poor negative correlation between the proportion of Immigrants from Caribbean and poverty level among single mothers in the United States with a correlation coefficient (R) of -0.173 and weighted average of 31.1%, a difference of 4.2%.
Single Mother Poverty Correlation Summary
| Measurement | Liberian | Immigrants from Caribbean |
| Minimum | 1.1% | 14.1% |
| Maximum | 77.3% | 47.6% |
| Range | 76.3% | 33.5% |
| Mean | 30.4% | 30.2% |
| Median | 28.0% | 30.1% |
| Interquartile 25% (IQ1) | 24.7% | 26.7% |
| Interquartile 75% (IQ3) | 35.5% | 34.2% |
| Interquartile Range (IQR) | 10.8% | 7.4% |
| Standard Deviation (Sample) | 13.6% | 6.1% |
| Standard Deviation (Population) | 13.5% | 6.0% |
Similar Demographics by Single Mother Poverty
Demographics Similar to Liberians by Single Mother Poverty
In terms of single mother poverty, the demographic groups most similar to Liberians are Jamaican (29.9%, a difference of 0.0%), Immigrants from Western Africa (29.9%, a difference of 0.020%), Immigrants from Thailand (29.9%, a difference of 0.030%), Immigrants from Ghana (29.9%, a difference of 0.050%), and Nicaraguan (29.8%, a difference of 0.080%).
| Demographics | Rating | Rank | Single Mother Poverty |
| Immigrants | Panama | 15.5 /100 | #207 | Poor 29.8% |
| Immigrants | Guyana | 14.7 /100 | #208 | Poor 29.8% |
| Irish | 13.9 /100 | #209 | Poor 29.8% |
| Haitians | 13.3 /100 | #210 | Poor 29.8% |
| Guyanese | 12.8 /100 | #211 | Poor 29.8% |
| Nicaraguans | 12.4 /100 | #212 | Poor 29.8% |
| Immigrants | Thailand | 12.0 /100 | #213 | Poor 29.9% |
| Liberians | 11.7 /100 | #214 | Poor 29.9% |
| Jamaicans | 11.7 /100 | #215 | Poor 29.9% |
| Immigrants | Western Africa | 11.5 /100 | #216 | Poor 29.9% |
| Immigrants | Ghana | 11.3 /100 | #217 | Poor 29.9% |
| Hungarians | 10.3 /100 | #218 | Poor 29.9% |
| Finns | 9.3 /100 | #219 | Tragic 30.0% |
| Germans | 8.8 /100 | #220 | Tragic 30.0% |
| Immigrants | Eritrea | 7.7 /100 | #221 | Tragic 30.0% |
Demographics Similar to Immigrants from Caribbean by Single Mother Poverty
In terms of single mother poverty, the demographic groups most similar to Immigrants from Caribbean are Immigrants from Bangladesh (31.1%, a difference of 0.030%), Immigrants from Bahamas (31.1%, a difference of 0.090%), Immigrants from West Indies (31.1%, a difference of 0.13%), White/Caucasian (31.2%, a difference of 0.19%), and Immigrants from El Salvador (31.2%, a difference of 0.27%).
| Demographics | Rating | Rank | Single Mother Poverty |
| Tlingit-Haida | 0.6 /100 | #251 | Tragic 30.9% |
| Alaska Natives | 0.6 /100 | #252 | Tragic 30.9% |
| Celtics | 0.6 /100 | #253 | Tragic 30.9% |
| Senegalese | 0.5 /100 | #254 | Tragic 31.0% |
| Belizeans | 0.5 /100 | #255 | Tragic 31.0% |
| Immigrants | West Indies | 0.4 /100 | #256 | Tragic 31.1% |
| Immigrants | Bahamas | 0.4 /100 | #257 | Tragic 31.1% |
| Immigrants | Caribbean | 0.4 /100 | #258 | Tragic 31.1% |
| Immigrants | Bangladesh | 0.4 /100 | #259 | Tragic 31.1% |
| Whites/Caucasians | 0.3 /100 | #260 | Tragic 31.2% |
| Immigrants | El Salvador | 0.3 /100 | #261 | Tragic 31.2% |
| Hmong | 0.3 /100 | #262 | Tragic 31.2% |
| Bahamians | 0.2 /100 | #263 | Tragic 31.3% |
| Immigrants | Ecuador | 0.2 /100 | #264 | Tragic 31.3% |
| German Russians | 0.2 /100 | #265 | Tragic 31.3% |