Okinawan vs Scotch-Irish Single Female Poverty
COMPARE
Okinawan
Scotch-Irish
Single Female Poverty
Single Female Poverty Comparison
Okinawans
Scotch-Irish
18.8%
SINGLE FEMALE POVERTY
99.9/ 100
METRIC RATING
40th/ 347
METRIC RANK
22.9%
SINGLE FEMALE POVERTY
0.3/ 100
METRIC RATING
263rd/ 347
METRIC RANK
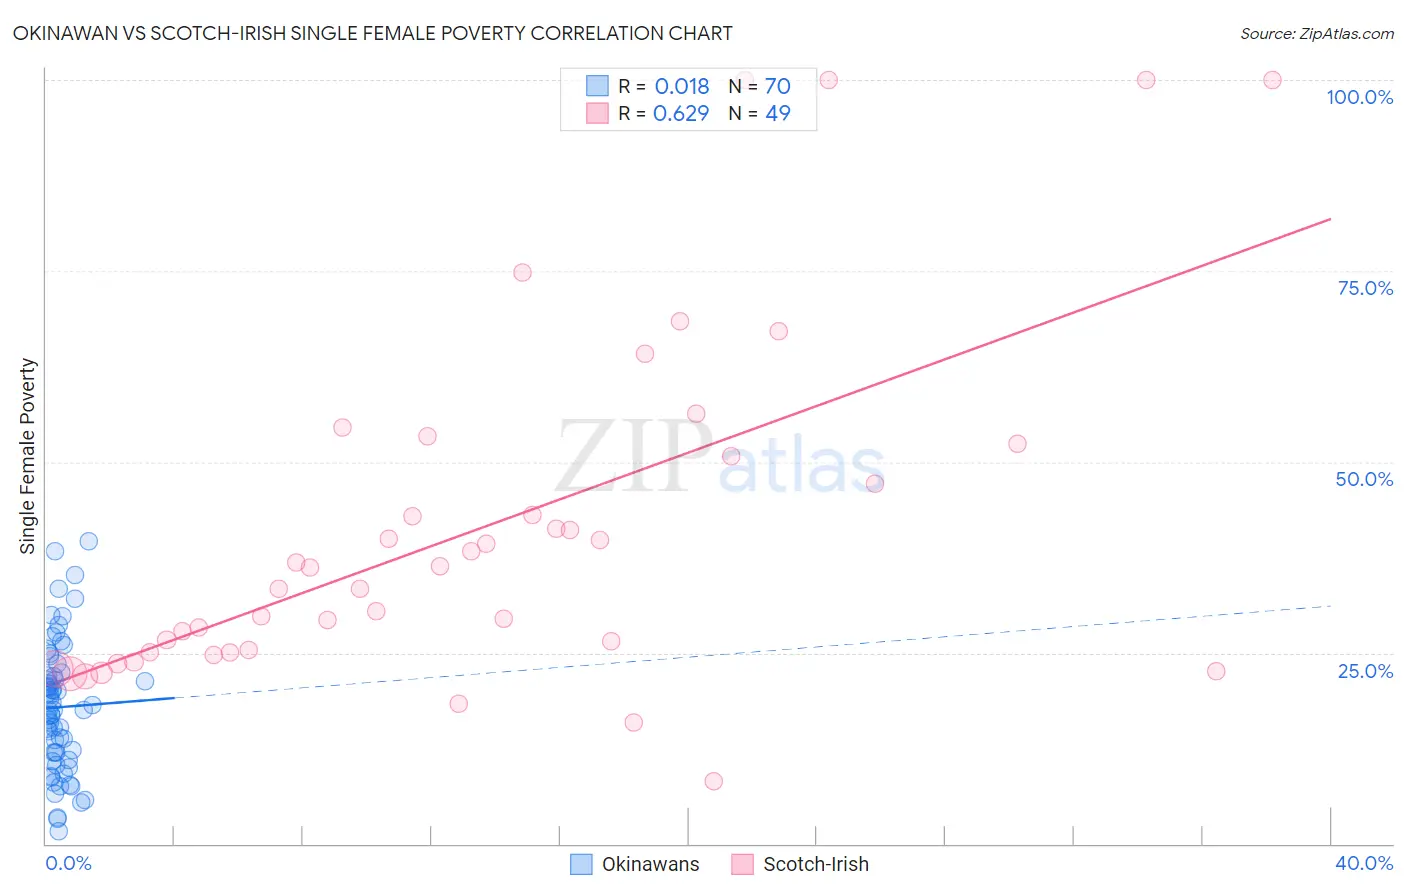
Okinawan vs Scotch-Irish Single Female Poverty Correlation Chart
The statistical analysis conducted on geographies consisting of 73,373,565 people shows no correlation between the proportion of Okinawans and poverty level among single females in the United States with a correlation coefficient (R) of 0.018 and weighted average of 18.8%. Similarly, the statistical analysis conducted on geographies consisting of 531,342,644 people shows a significant positive correlation between the proportion of Scotch-Irish and poverty level among single females in the United States with a correlation coefficient (R) of 0.629 and weighted average of 22.9%, a difference of 22.0%.
Single Female Poverty Correlation Summary
| Measurement | Okinawan | Scotch-Irish |
| Minimum | 1.6% | 8.1% |
| Maximum | 39.6% | 100.0% |
| Range | 38.0% | 91.9% |
| Mean | 17.9% | 41.2% |
| Median | 17.5% | 36.1% |
| Interquartile 25% (IQ1) | 11.9% | 25.0% |
| Interquartile 75% (IQ3) | 21.9% | 51.6% |
| Interquartile Range (IQR) | 10.0% | 26.6% |
| Standard Deviation (Sample) | 8.4% | 22.8% |
| Standard Deviation (Population) | 8.4% | 22.5% |
Similar Demographics by Single Female Poverty
Demographics Similar to Okinawans by Single Female Poverty
In terms of single female poverty, the demographic groups most similar to Okinawans are Immigrants from Serbia (18.8%, a difference of 0.020%), Bulgarian (18.8%, a difference of 0.030%), Tongan (18.8%, a difference of 0.060%), Jordanian (18.8%, a difference of 0.090%), and Immigrants from Romania (18.8%, a difference of 0.25%).
| Demographics | Rating | Rank | Single Female Poverty |
| Immigrants | Philippines | 99.9 /100 | #33 | Exceptional 18.6% |
| Koreans | 99.9 /100 | #34 | Exceptional 18.6% |
| Immigrants | Japan | 99.9 /100 | #35 | Exceptional 18.6% |
| Turks | 99.9 /100 | #36 | Exceptional 18.7% |
| Immigrants | Armenia | 99.9 /100 | #37 | Exceptional 18.7% |
| Tongans | 99.9 /100 | #38 | Exceptional 18.8% |
| Bulgarians | 99.9 /100 | #39 | Exceptional 18.8% |
| Okinawans | 99.9 /100 | #40 | Exceptional 18.8% |
| Immigrants | Serbia | 99.9 /100 | #41 | Exceptional 18.8% |
| Jordanians | 99.9 /100 | #42 | Exceptional 18.8% |
| Immigrants | Romania | 99.9 /100 | #43 | Exceptional 18.8% |
| Immigrants | Croatia | 99.9 /100 | #44 | Exceptional 18.9% |
| Immigrants | Indonesia | 99.8 /100 | #45 | Exceptional 18.9% |
| Macedonians | 99.8 /100 | #46 | Exceptional 18.9% |
| Latvians | 99.8 /100 | #47 | Exceptional 19.0% |
Demographics Similar to Scotch-Irish by Single Female Poverty
In terms of single female poverty, the demographic groups most similar to Scotch-Irish are Immigrants from Laos (22.9%, a difference of 0.070%), Central American (23.0%, a difference of 0.24%), British West Indian (22.8%, a difference of 0.41%), Immigrants from Micronesia (23.0%, a difference of 0.45%), and Senegalese (23.0%, a difference of 0.51%).
| Demographics | Rating | Rank | Single Female Poverty |
| Immigrants | Belize | 0.8 /100 | #256 | Tragic 22.6% |
| Sudanese | 0.7 /100 | #257 | Tragic 22.6% |
| Bahamians | 0.6 /100 | #258 | Tragic 22.7% |
| Whites/Caucasians | 0.6 /100 | #259 | Tragic 22.7% |
| Celtics | 0.5 /100 | #260 | Tragic 22.7% |
| Immigrants | Cabo Verde | 0.4 /100 | #261 | Tragic 22.8% |
| British West Indians | 0.4 /100 | #262 | Tragic 22.8% |
| Scotch-Irish | 0.3 /100 | #263 | Tragic 22.9% |
| Immigrants | Laos | 0.3 /100 | #264 | Tragic 22.9% |
| Central Americans | 0.2 /100 | #265 | Tragic 23.0% |
| Immigrants | Micronesia | 0.2 /100 | #266 | Tragic 23.0% |
| Senegalese | 0.2 /100 | #267 | Tragic 23.0% |
| Fijians | 0.2 /100 | #268 | Tragic 23.1% |
| Hmong | 0.2 /100 | #269 | Tragic 23.1% |
| Inupiat | 0.2 /100 | #270 | Tragic 23.1% |