Scottish vs Burmese Single Mother Poverty
COMPARE
Scottish
Burmese
Single Mother Poverty
Single Mother Poverty Comparison
Scottish
Burmese
30.1%
SINGLE MOTHER POVERTY
6.0/ 100
METRIC RATING
226th/ 347
METRIC RANK
26.2%
SINGLE MOTHER POVERTY
100.0/ 100
METRIC RATING
23rd/ 347
METRIC RANK
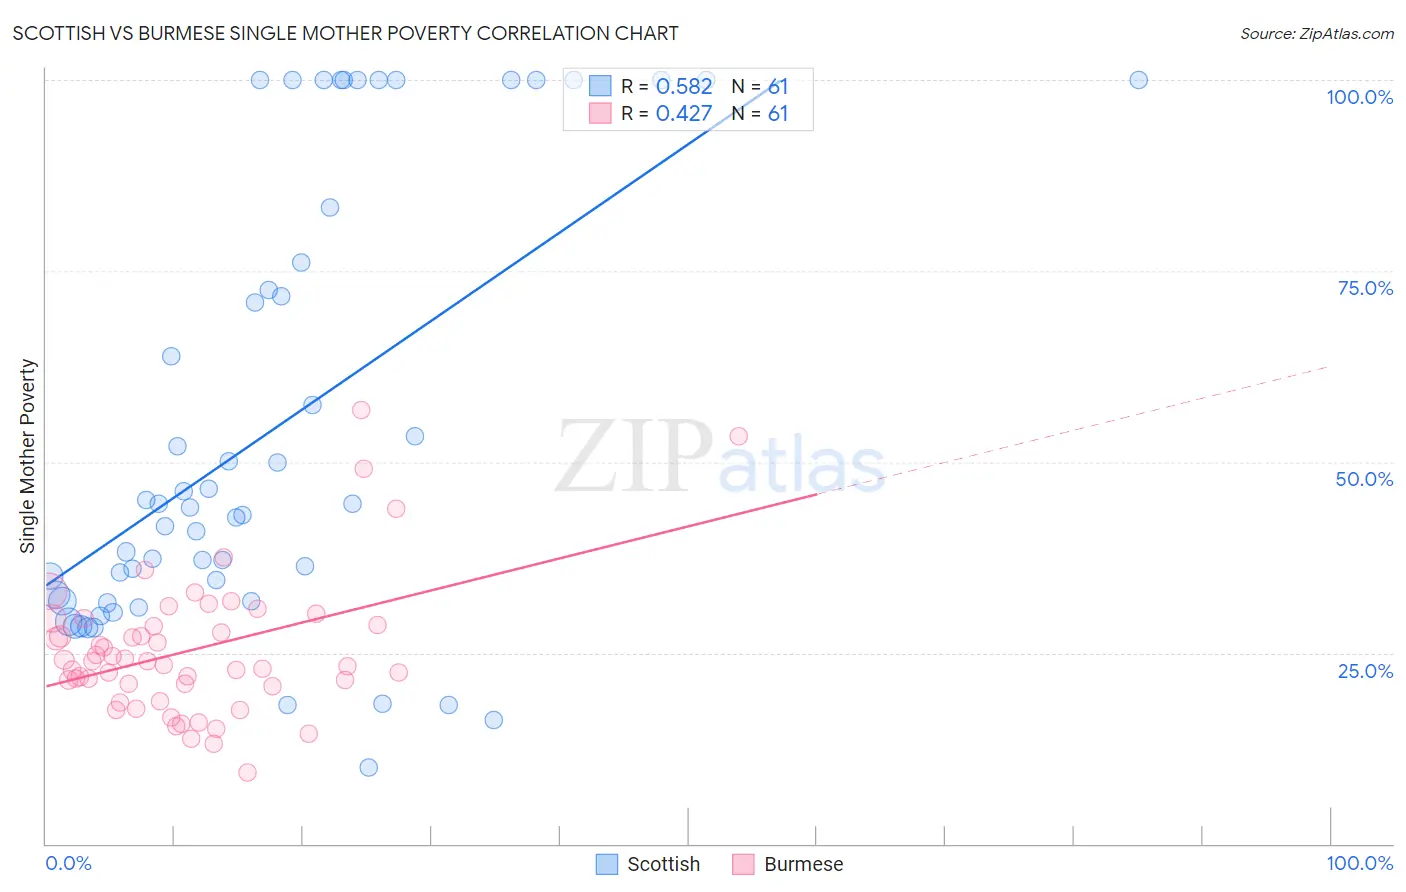
Scottish vs Burmese Single Mother Poverty Correlation Chart
The statistical analysis conducted on geographies consisting of 539,065,597 people shows a substantial positive correlation between the proportion of Scottish and poverty level among single mothers in the United States with a correlation coefficient (R) of 0.582 and weighted average of 30.1%. Similarly, the statistical analysis conducted on geographies consisting of 450,482,396 people shows a moderate positive correlation between the proportion of Burmese and poverty level among single mothers in the United States with a correlation coefficient (R) of 0.427 and weighted average of 26.2%, a difference of 14.8%.
Single Mother Poverty Correlation Summary
| Measurement | Scottish | Burmese |
| Minimum | 10.0% | 9.3% |
| Maximum | 100.0% | 56.9% |
| Range | 90.0% | 47.5% |
| Mean | 54.2% | 25.3% |
| Median | 44.1% | 23.9% |
| Interquartile 25% (IQ1) | 31.8% | 20.8% |
| Interquartile 75% (IQ3) | 79.8% | 29.0% |
| Interquartile Range (IQR) | 48.0% | 8.3% |
| Standard Deviation (Sample) | 28.9% | 9.0% |
| Standard Deviation (Population) | 28.6% | 9.0% |
Similar Demographics by Single Mother Poverty
Demographics Similar to Scottish by Single Mother Poverty
In terms of single mother poverty, the demographic groups most similar to Scottish are Immigrants from Liberia (30.1%, a difference of 0.030%), Spanish (30.1%, a difference of 0.060%), Immigrants from Sudan (30.1%, a difference of 0.090%), Spaniard (30.2%, a difference of 0.14%), and Immigrants from Cuba (30.1%, a difference of 0.16%).
| Demographics | Rating | Rank | Single Mother Poverty |
| Finns | 9.3 /100 | #219 | Tragic 30.0% |
| Germans | 8.8 /100 | #220 | Tragic 30.0% |
| Immigrants | Eritrea | 7.7 /100 | #221 | Tragic 30.0% |
| Sudanese | 7.6 /100 | #222 | Tragic 30.0% |
| Immigrants | Cuba | 6.9 /100 | #223 | Tragic 30.1% |
| Immigrants | Sudan | 6.5 /100 | #224 | Tragic 30.1% |
| Spanish | 6.3 /100 | #225 | Tragic 30.1% |
| Scottish | 6.0 /100 | #226 | Tragic 30.1% |
| Immigrants | Liberia | 5.9 /100 | #227 | Tragic 30.1% |
| Spaniards | 5.4 /100 | #228 | Tragic 30.2% |
| Immigrants | Barbados | 5.0 /100 | #229 | Tragic 30.2% |
| English | 4.8 /100 | #230 | Tragic 30.2% |
| Dutch | 4.3 /100 | #231 | Tragic 30.2% |
| Alaskan Athabascans | 4.1 /100 | #232 | Tragic 30.3% |
| Immigrants | Middle Africa | 3.5 /100 | #233 | Tragic 30.3% |
Demographics Similar to Burmese by Single Mother Poverty
In terms of single mother poverty, the demographic groups most similar to Burmese are Immigrants from Moldova (26.2%, a difference of 0.020%), Immigrants from Korea (26.2%, a difference of 0.17%), Immigrants from Asia (26.3%, a difference of 0.22%), Immigrants from Bolivia (26.2%, a difference of 0.35%), and Immigrants from Sri Lanka (26.3%, a difference of 0.35%).
| Demographics | Rating | Rank | Single Mother Poverty |
| Bolivians | 100.0 /100 | #16 | Exceptional 25.9% |
| Asians | 100.0 /100 | #17 | Exceptional 26.0% |
| Immigrants | Pakistan | 100.0 /100 | #18 | Exceptional 26.0% |
| Immigrants | Eastern Asia | 100.0 /100 | #19 | Exceptional 26.1% |
| Immigrants | China | 100.0 /100 | #20 | Exceptional 26.1% |
| Immigrants | Bolivia | 100.0 /100 | #21 | Exceptional 26.2% |
| Immigrants | Korea | 100.0 /100 | #22 | Exceptional 26.2% |
| Burmese | 100.0 /100 | #23 | Exceptional 26.2% |
| Immigrants | Moldova | 100.0 /100 | #24 | Exceptional 26.2% |
| Immigrants | Asia | 100.0 /100 | #25 | Exceptional 26.3% |
| Immigrants | Sri Lanka | 100.0 /100 | #26 | Exceptional 26.3% |
| Immigrants | Japan | 100.0 /100 | #27 | Exceptional 26.4% |
| Koreans | 100.0 /100 | #28 | Exceptional 26.4% |
| Jordanians | 100.0 /100 | #29 | Exceptional 26.4% |
| Turks | 100.0 /100 | #30 | Exceptional 26.4% |