Scottish vs Hopi Single Mother Poverty
COMPARE
Scottish
Hopi
Single Mother Poverty
Single Mother Poverty Comparison
Scottish
Hopi
30.1%
SINGLE MOTHER POVERTY
6.0/ 100
METRIC RATING
226th/ 347
METRIC RANK
34.5%
SINGLE MOTHER POVERTY
0.0/ 100
METRIC RATING
315th/ 347
METRIC RANK
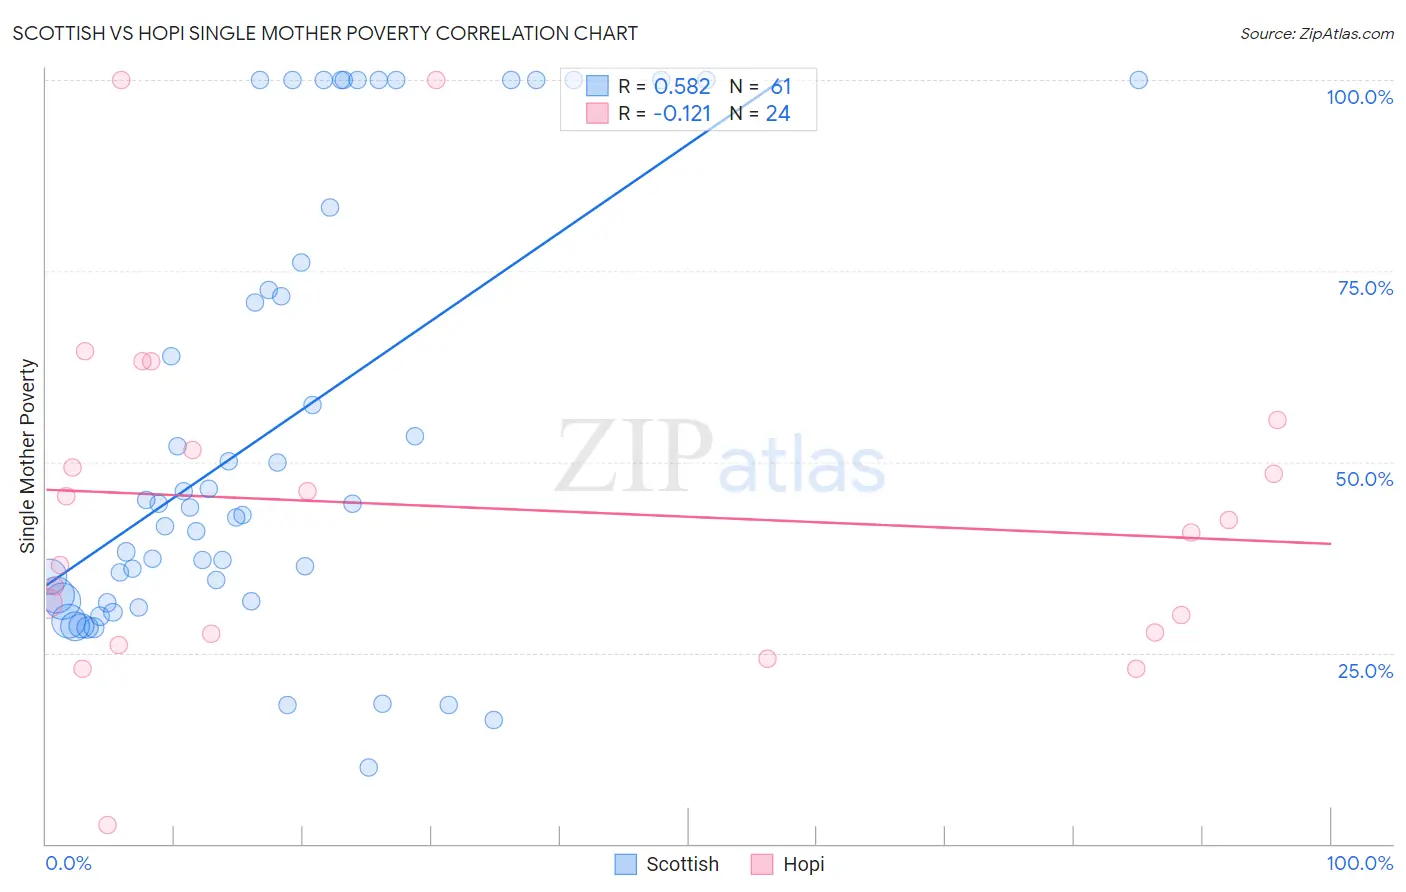
Scottish vs Hopi Single Mother Poverty Correlation Chart
The statistical analysis conducted on geographies consisting of 539,065,597 people shows a substantial positive correlation between the proportion of Scottish and poverty level among single mothers in the United States with a correlation coefficient (R) of 0.582 and weighted average of 30.1%. Similarly, the statistical analysis conducted on geographies consisting of 74,456,192 people shows a poor negative correlation between the proportion of Hopi and poverty level among single mothers in the United States with a correlation coefficient (R) of -0.121 and weighted average of 34.5%, a difference of 14.4%.
Single Mother Poverty Correlation Summary
| Measurement | Scottish | Hopi |
| Minimum | 10.0% | 2.5% |
| Maximum | 100.0% | 100.0% |
| Range | 90.0% | 97.5% |
| Mean | 54.2% | 44.0% |
| Median | 44.1% | 41.6% |
| Interquartile 25% (IQ1) | 31.8% | 27.6% |
| Interquartile 75% (IQ3) | 79.8% | 53.5% |
| Interquartile Range (IQR) | 48.0% | 26.0% |
| Standard Deviation (Sample) | 28.9% | 22.9% |
| Standard Deviation (Population) | 28.6% | 22.4% |
Similar Demographics by Single Mother Poverty
Demographics Similar to Scottish by Single Mother Poverty
In terms of single mother poverty, the demographic groups most similar to Scottish are Immigrants from Liberia (30.1%, a difference of 0.030%), Spanish (30.1%, a difference of 0.060%), Immigrants from Sudan (30.1%, a difference of 0.090%), Spaniard (30.2%, a difference of 0.14%), and Immigrants from Cuba (30.1%, a difference of 0.16%).
| Demographics | Rating | Rank | Single Mother Poverty |
| Finns | 9.3 /100 | #219 | Tragic 30.0% |
| Germans | 8.8 /100 | #220 | Tragic 30.0% |
| Immigrants | Eritrea | 7.7 /100 | #221 | Tragic 30.0% |
| Sudanese | 7.6 /100 | #222 | Tragic 30.0% |
| Immigrants | Cuba | 6.9 /100 | #223 | Tragic 30.1% |
| Immigrants | Sudan | 6.5 /100 | #224 | Tragic 30.1% |
| Spanish | 6.3 /100 | #225 | Tragic 30.1% |
| Scottish | 6.0 /100 | #226 | Tragic 30.1% |
| Immigrants | Liberia | 5.9 /100 | #227 | Tragic 30.1% |
| Spaniards | 5.4 /100 | #228 | Tragic 30.2% |
| Immigrants | Barbados | 5.0 /100 | #229 | Tragic 30.2% |
| English | 4.8 /100 | #230 | Tragic 30.2% |
| Dutch | 4.3 /100 | #231 | Tragic 30.2% |
| Alaskan Athabascans | 4.1 /100 | #232 | Tragic 30.3% |
| Immigrants | Middle Africa | 3.5 /100 | #233 | Tragic 30.3% |
Demographics Similar to Hopi by Single Mother Poverty
In terms of single mother poverty, the demographic groups most similar to Hopi are Chickasaw (34.4%, a difference of 0.080%), Dominican (34.5%, a difference of 0.12%), Cherokee (34.5%, a difference of 0.22%), Immigrants from Dominican Republic (34.4%, a difference of 0.25%), and Central American Indian (34.3%, a difference of 0.34%).
| Demographics | Rating | Rank | Single Mother Poverty |
| Immigrants | Mexico | 0.0 /100 | #308 | Tragic 34.0% |
| Potawatomi | 0.0 /100 | #309 | Tragic 34.1% |
| Hondurans | 0.0 /100 | #310 | Tragic 34.2% |
| Alsatians | 0.0 /100 | #311 | Tragic 34.3% |
| Central American Indians | 0.0 /100 | #312 | Tragic 34.3% |
| Immigrants | Dominican Republic | 0.0 /100 | #313 | Tragic 34.4% |
| Chickasaw | 0.0 /100 | #314 | Tragic 34.4% |
| Hopi | 0.0 /100 | #315 | Tragic 34.5% |
| Dominicans | 0.0 /100 | #316 | Tragic 34.5% |
| Cherokee | 0.0 /100 | #317 | Tragic 34.5% |
| Immigrants | Honduras | 0.0 /100 | #318 | Tragic 34.7% |
| Chippewa | 0.0 /100 | #319 | Tragic 34.8% |
| Iroquois | 0.0 /100 | #320 | Tragic 34.8% |
| Paiute | 0.0 /100 | #321 | Tragic 35.1% |
| Blacks/African Americans | 0.0 /100 | #322 | Tragic 35.2% |