Scottish vs Apache Unemployment Among Women with Children Under 6 years
COMPARE
Scottish
Apache
Unemployment Among Women with Children Under 6 years
Unemployment Among Women with Children Under 6 years Comparison
Scottish
Apache
7.9%
UNEMPLOYMENT AMONG WOMEN WITH CHILDREN UNDER 6 YEARS
11.4/ 100
METRIC RATING
213th/ 347
METRIC RANK
12.3%
UNEMPLOYMENT AMONG WOMEN WITH CHILDREN UNDER 6 YEARS
0.0/ 100
METRIC RATING
334th/ 347
METRIC RANK
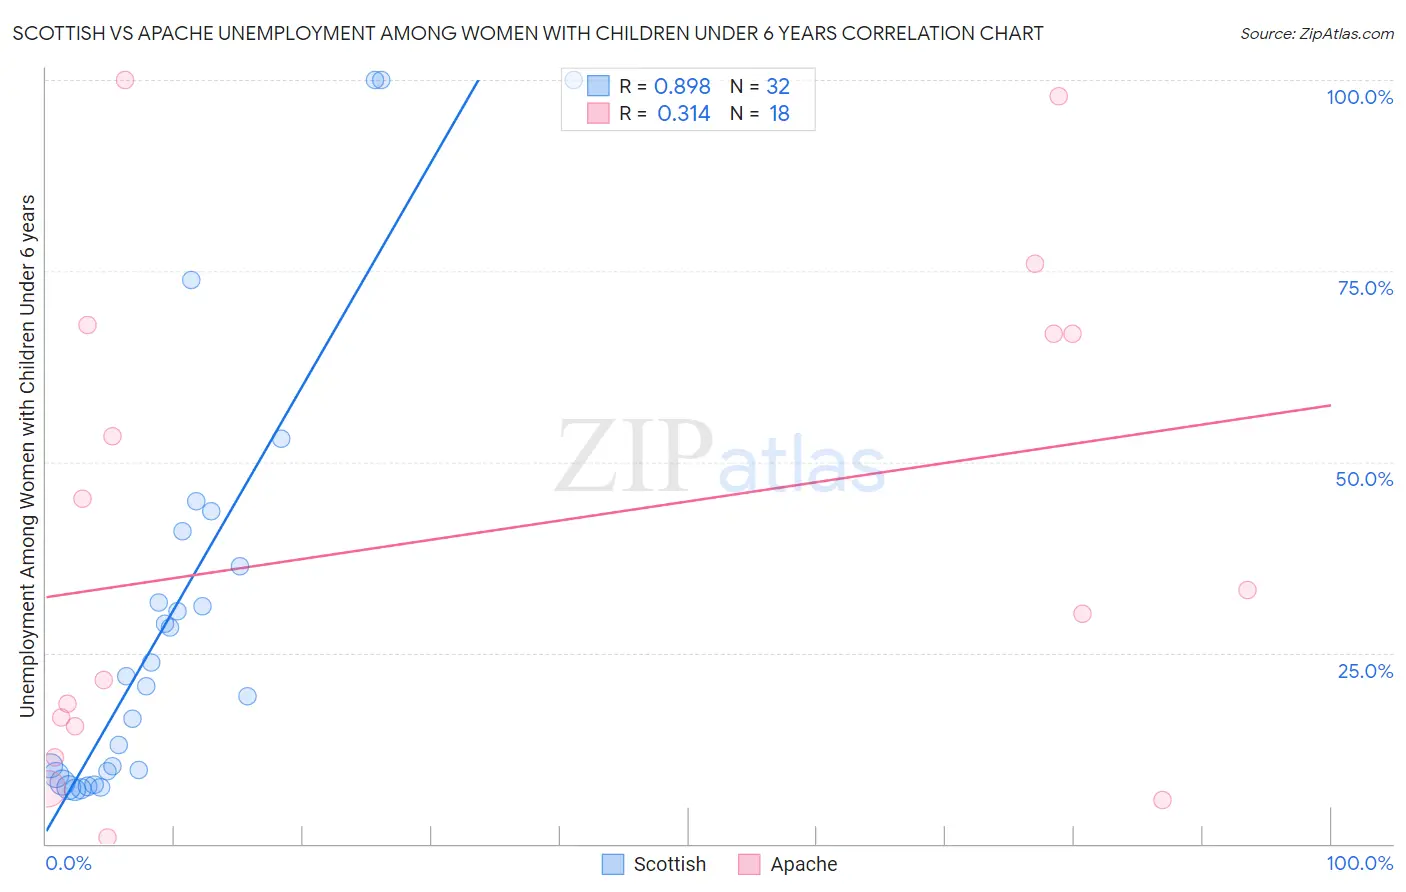
Scottish vs Apache Unemployment Among Women with Children Under 6 years Correlation Chart
The statistical analysis conducted on geographies consisting of 373,703,612 people shows a very strong positive correlation between the proportion of Scottish and unemployment rate among women with children under the age of 6 in the United States with a correlation coefficient (R) of 0.898 and weighted average of 7.9%. Similarly, the statistical analysis conducted on geographies consisting of 192,370,998 people shows a mild positive correlation between the proportion of Apache and unemployment rate among women with children under the age of 6 in the United States with a correlation coefficient (R) of 0.314 and weighted average of 12.3%, a difference of 55.8%.
Unemployment Among Women with Children Under 6 years Correlation Summary
| Measurement | Scottish | Apache |
| Minimum | 7.1% | 0.90% |
| Maximum | 100.0% | 100.0% |
| Range | 92.9% | 99.1% |
| Mean | 30.0% | 40.8% |
| Median | 21.3% | 31.7% |
| Interquartile 25% (IQ1) | 9.2% | 15.3% |
| Interquartile 75% (IQ3) | 38.7% | 66.7% |
| Interquartile Range (IQR) | 29.4% | 51.4% |
| Standard Deviation (Sample) | 27.9% | 31.9% |
| Standard Deviation (Population) | 27.5% | 31.0% |
Similar Demographics by Unemployment Among Women with Children Under 6 years
Demographics Similar to Scottish by Unemployment Among Women with Children Under 6 years
In terms of unemployment among women with children under 6 years, the demographic groups most similar to Scottish are Spanish (7.9%, a difference of 0.020%), Ecuadorian (7.9%, a difference of 0.040%), Immigrants from Lebanon (7.9%, a difference of 0.050%), Swiss (7.9%, a difference of 0.13%), and Immigrants from Nigeria (7.9%, a difference of 0.17%).
| Demographics | Rating | Rank | Unemployment Among Women with Children Under 6 years |
| Hungarians | 21.2 /100 | #206 | Fair 7.8% |
| Canadians | 20.6 /100 | #207 | Fair 7.8% |
| Immigrants | Syria | 18.9 /100 | #208 | Poor 7.8% |
| Costa Ricans | 17.6 /100 | #209 | Poor 7.8% |
| Poles | 16.0 /100 | #210 | Poor 7.9% |
| Immigrants | Ecuador | 14.9 /100 | #211 | Poor 7.9% |
| Swiss | 12.3 /100 | #212 | Poor 7.9% |
| Scottish | 11.4 /100 | #213 | Poor 7.9% |
| Spanish | 11.3 /100 | #214 | Poor 7.9% |
| Ecuadorians | 11.2 /100 | #215 | Poor 7.9% |
| Immigrants | Lebanon | 11.1 /100 | #216 | Poor 7.9% |
| Immigrants | Nigeria | 10.3 /100 | #217 | Poor 7.9% |
| Moroccans | 9.7 /100 | #218 | Tragic 7.9% |
| Arabs | 9.4 /100 | #219 | Tragic 7.9% |
| South American Indians | 9.3 /100 | #220 | Tragic 7.9% |
Demographics Similar to Apache by Unemployment Among Women with Children Under 6 years
In terms of unemployment among women with children under 6 years, the demographic groups most similar to Apache are Puerto Rican (12.5%, a difference of 1.8%), Native/Alaskan (11.5%, a difference of 6.9%), Shoshone (13.2%, a difference of 7.0%), Sioux (11.5%, a difference of 7.5%), and Chippewa (13.3%, a difference of 8.2%).
| Demographics | Rating | Rank | Unemployment Among Women with Children Under 6 years |
| Ottawa | 0.0 /100 | #327 | Tragic 9.9% |
| Tohono O'odham | 0.0 /100 | #328 | Tragic 10.2% |
| Blacks/African Americans | 0.0 /100 | #329 | Tragic 10.3% |
| Pennsylvania Germans | 0.0 /100 | #330 | Tragic 10.8% |
| Colville | 0.0 /100 | #331 | Tragic 11.2% |
| Sioux | 0.0 /100 | #332 | Tragic 11.5% |
| Natives/Alaskans | 0.0 /100 | #333 | Tragic 11.5% |
| Apache | 0.0 /100 | #334 | Tragic 12.3% |
| Puerto Ricans | 0.0 /100 | #335 | Tragic 12.5% |
| Shoshone | 0.0 /100 | #336 | Tragic 13.2% |
| Chippewa | 0.0 /100 | #337 | Tragic 13.3% |
| Pima | 0.0 /100 | #338 | Tragic 13.4% |
| Navajo | 0.0 /100 | #339 | Tragic 13.5% |
| Immigrants | Yemen | 0.0 /100 | #340 | Tragic 13.5% |
| Lumbee | 0.0 /100 | #341 | Tragic 13.8% |