West Indian vs Immigrants from Ecuador Single Father Poverty
COMPARE
West Indian
Immigrants from Ecuador
Single Father Poverty
Single Father Poverty Comparison
West Indians
Immigrants from Ecuador
18.0%
SINGLE FATHER POVERTY
0.0/ 100
METRIC RATING
290th/ 347
METRIC RANK
16.3%
SINGLE FATHER POVERTY
49.7/ 100
METRIC RATING
175th/ 347
METRIC RANK
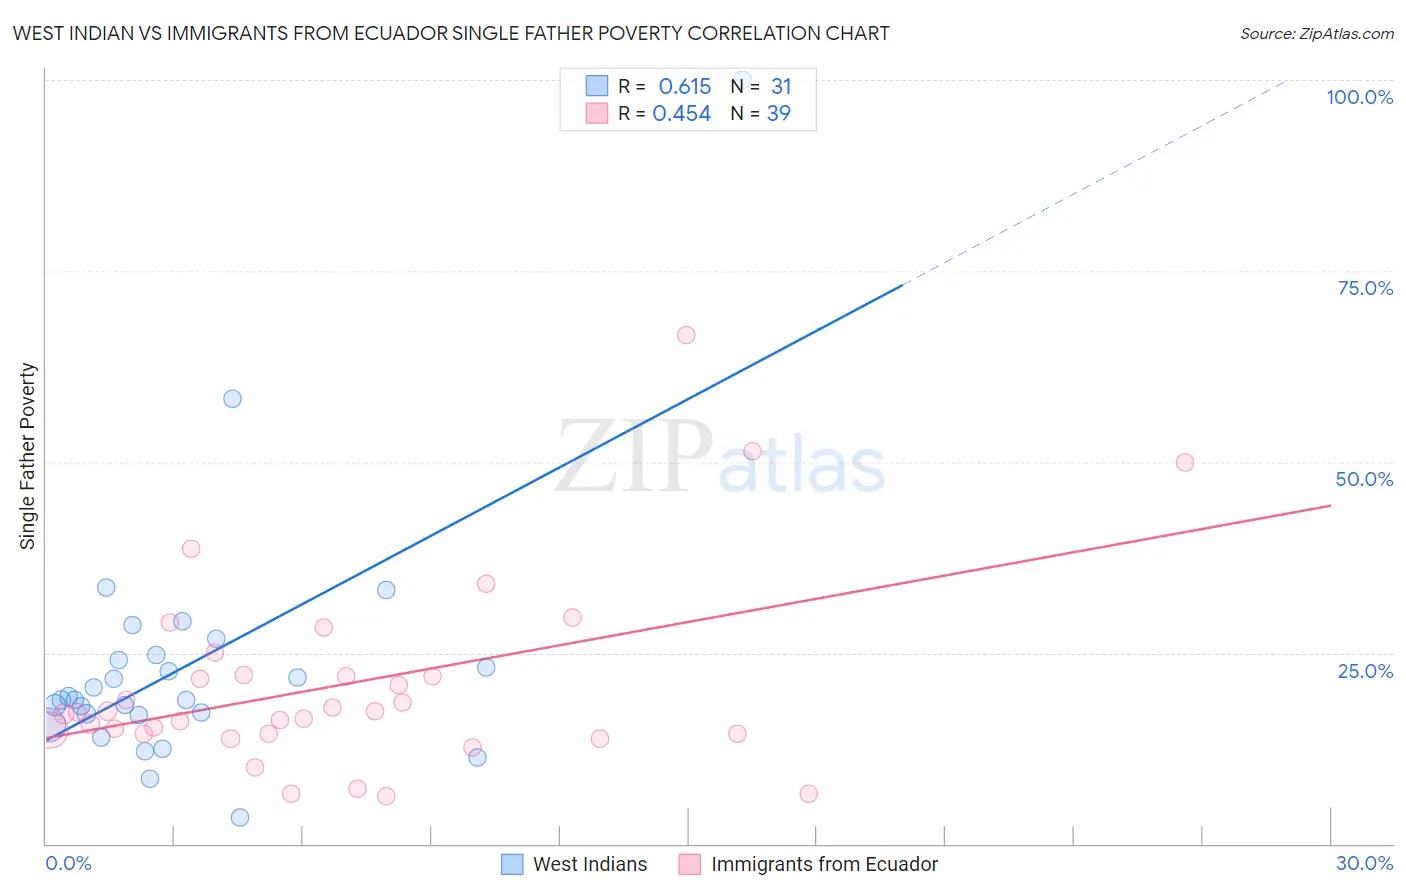
West Indian vs Immigrants from Ecuador Single Father Poverty Correlation Chart
The statistical analysis conducted on geographies consisting of 216,434,953 people shows a significant positive correlation between the proportion of West Indians and poverty level among single fathers in the United States with a correlation coefficient (R) of 0.615 and weighted average of 18.0%. Similarly, the statistical analysis conducted on geographies consisting of 223,687,874 people shows a moderate positive correlation between the proportion of Immigrants from Ecuador and poverty level among single fathers in the United States with a correlation coefficient (R) of 0.454 and weighted average of 16.3%, a difference of 10.7%.
Single Father Poverty Correlation Summary
| Measurement | West Indian | Immigrants from Ecuador |
| Minimum | 3.5% | 6.2% |
| Maximum | 100.0% | 66.7% |
| Range | 96.5% | 60.5% |
| Mean | 23.4% | 20.9% |
| Median | 18.9% | 17.3% |
| Interquartile 25% (IQ1) | 16.8% | 14.3% |
| Interquartile 75% (IQ3) | 24.6% | 22.0% |
| Interquartile Range (IQR) | 7.8% | 7.7% |
| Standard Deviation (Sample) | 17.1% | 12.7% |
| Standard Deviation (Population) | 16.9% | 12.5% |
Similar Demographics by Single Father Poverty
Demographics Similar to West Indians by Single Father Poverty
In terms of single father poverty, the demographic groups most similar to West Indians are Irish (18.0%, a difference of 0.030%), Alaskan Athabascan (18.1%, a difference of 0.22%), Immigrants from Bahamas (18.1%, a difference of 0.23%), Alaska Native (18.1%, a difference of 0.34%), and U.S. Virgin Islander (18.1%, a difference of 0.36%).
| Demographics | Rating | Rank | Single Father Poverty |
| Alsatians | 0.0 /100 | #283 | Tragic 17.8% |
| Welsh | 0.0 /100 | #284 | Tragic 17.8% |
| Immigrants | Lebanon | 0.0 /100 | #285 | Tragic 17.9% |
| Immigrants | North Macedonia | 0.0 /100 | #286 | Tragic 17.9% |
| Carpatho Rusyns | 0.0 /100 | #287 | Tragic 18.0% |
| Bahamians | 0.0 /100 | #288 | Tragic 18.0% |
| Irish | 0.0 /100 | #289 | Tragic 18.0% |
| West Indians | 0.0 /100 | #290 | Tragic 18.0% |
| Alaskan Athabascans | 0.0 /100 | #291 | Tragic 18.1% |
| Immigrants | Bahamas | 0.0 /100 | #292 | Tragic 18.1% |
| Alaska Natives | 0.0 /100 | #293 | Tragic 18.1% |
| U.S. Virgin Islanders | 0.0 /100 | #294 | Tragic 18.1% |
| Yakama | 0.0 /100 | #295 | Tragic 18.1% |
| Seminole | 0.0 /100 | #296 | Tragic 18.1% |
| French | 0.0 /100 | #297 | Tragic 18.2% |
Demographics Similar to Immigrants from Ecuador by Single Father Poverty
In terms of single father poverty, the demographic groups most similar to Immigrants from Ecuador are Immigrants from Sierra Leone (16.3%, a difference of 0.020%), Immigrants from St. Vincent and the Grenadines (16.3%, a difference of 0.020%), Swedish (16.3%, a difference of 0.020%), Immigrants from Morocco (16.3%, a difference of 0.050%), and Vietnamese (16.3%, a difference of 0.070%).
| Demographics | Rating | Rank | Single Father Poverty |
| Costa Ricans | 53.6 /100 | #168 | Average 16.3% |
| Northern Europeans | 52.8 /100 | #169 | Average 16.3% |
| Scandinavians | 52.3 /100 | #170 | Average 16.3% |
| Immigrants | Morocco | 50.7 /100 | #171 | Average 16.3% |
| Immigrants | Sierra Leone | 50.1 /100 | #172 | Average 16.3% |
| Immigrants | St. Vincent and the Grenadines | 50.0 /100 | #173 | Average 16.3% |
| Swedes | 50.0 /100 | #174 | Average 16.3% |
| Immigrants | Ecuador | 49.7 /100 | #175 | Average 16.3% |
| Vietnamese | 48.0 /100 | #176 | Average 16.3% |
| Immigrants | South Africa | 44.2 /100 | #177 | Average 16.3% |
| Immigrants | Cuba | 41.6 /100 | #178 | Average 16.4% |
| Serbians | 40.9 /100 | #179 | Average 16.4% |
| Immigrants | Latin America | 37.2 /100 | #180 | Fair 16.4% |
| Immigrants | Western Africa | 36.0 /100 | #181 | Fair 16.4% |
| Immigrants | Italy | 35.7 /100 | #182 | Fair 16.4% |