Scotch-Irish vs Immigrants from Ecuador Single Mother Households
COMPARE
Scotch-Irish
Immigrants from Ecuador
Single Mother Households
Single Mother Households Comparison
Scotch-Irish
Immigrants from Ecuador
6.0%
SINGLE MOTHER HOUSEHOLDS
82.0/ 100
METRIC RATING
148th/ 347
METRIC RANK
7.3%
SINGLE MOTHER HOUSEHOLDS
0.3/ 100
METRIC RATING
254th/ 347
METRIC RANK
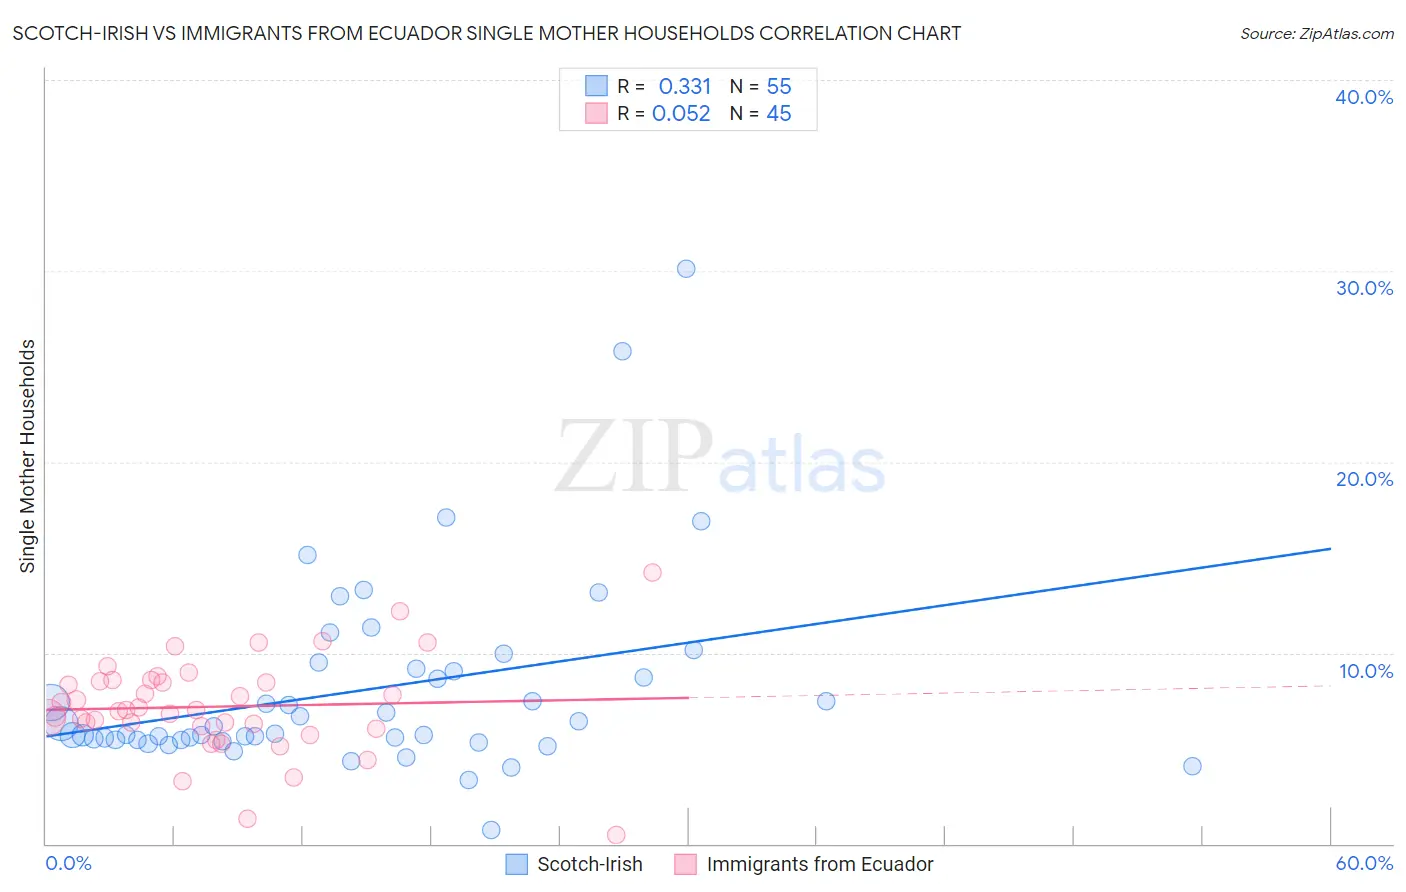
Scotch-Irish vs Immigrants from Ecuador Single Mother Households Correlation Chart
The statistical analysis conducted on geographies consisting of 544,486,743 people shows a mild positive correlation between the proportion of Scotch-Irish and percentage of single mother households in the United States with a correlation coefficient (R) of 0.331 and weighted average of 6.0%. Similarly, the statistical analysis conducted on geographies consisting of 270,615,585 people shows a slight positive correlation between the proportion of Immigrants from Ecuador and percentage of single mother households in the United States with a correlation coefficient (R) of 0.052 and weighted average of 7.3%, a difference of 21.3%.
Single Mother Households Correlation Summary
| Measurement | Scotch-Irish | Immigrants from Ecuador |
| Minimum | 0.72% | 0.47% |
| Maximum | 30.1% | 14.2% |
| Range | 29.4% | 13.7% |
| Mean | 8.1% | 7.2% |
| Median | 5.8% | 7.0% |
| Interquartile 25% (IQ1) | 5.4% | 6.1% |
| Interquartile 75% (IQ3) | 9.1% | 8.5% |
| Interquartile Range (IQR) | 3.7% | 2.5% |
| Standard Deviation (Sample) | 5.1% | 2.5% |
| Standard Deviation (Population) | 5.1% | 2.5% |
Similar Demographics by Single Mother Households
Demographics Similar to Scotch-Irish by Single Mother Households
In terms of single mother households, the demographic groups most similar to Scotch-Irish are Immigrants from Jordan (6.0%, a difference of 0.050%), Immigrants from Albania (6.1%, a difference of 0.10%), French Canadian (6.0%, a difference of 0.11%), Zimbabwean (6.1%, a difference of 0.24%), and Immigrants from Southern Europe (6.1%, a difference of 0.30%).
| Demographics | Rating | Rank | Single Mother Households |
| Tsimshian | 85.2 /100 | #141 | Excellent 6.0% |
| Immigrants | Egypt | 85.0 /100 | #142 | Excellent 6.0% |
| Immigrants | Iraq | 84.8 /100 | #143 | Excellent 6.0% |
| Koreans | 84.4 /100 | #144 | Excellent 6.0% |
| Arabs | 84.0 /100 | #145 | Excellent 6.0% |
| French Canadians | 82.6 /100 | #146 | Excellent 6.0% |
| Immigrants | Jordan | 82.3 /100 | #147 | Excellent 6.0% |
| Scotch-Irish | 82.0 /100 | #148 | Excellent 6.0% |
| Immigrants | Albania | 81.5 /100 | #149 | Excellent 6.1% |
| Zimbabweans | 80.7 /100 | #150 | Excellent 6.1% |
| Immigrants | Southern Europe | 80.5 /100 | #151 | Excellent 6.1% |
| Pakistanis | 79.2 /100 | #152 | Good 6.1% |
| Immigrants | Brazil | 78.9 /100 | #153 | Good 6.1% |
| Immigrants | Philippines | 78.5 /100 | #154 | Good 6.1% |
| Whites/Caucasians | 76.5 /100 | #155 | Good 6.1% |
Demographics Similar to Immigrants from Ecuador by Single Mother Households
In terms of single mother households, the demographic groups most similar to Immigrants from Ecuador are Cajun (7.3%, a difference of 0.050%), Mexican American Indian (7.4%, a difference of 0.37%), Alaskan Athabascan (7.3%, a difference of 0.44%), Malaysian (7.3%, a difference of 0.46%), and Seminole (7.4%, a difference of 0.73%).
| Demographics | Rating | Rank | Single Mother Households |
| Dutch West Indians | 0.4 /100 | #247 | Tragic 7.3% |
| Spanish American Indians | 0.4 /100 | #248 | Tragic 7.3% |
| Bermudans | 0.4 /100 | #249 | Tragic 7.3% |
| Immigrants | Africa | 0.4 /100 | #250 | Tragic 7.3% |
| Malaysians | 0.3 /100 | #251 | Tragic 7.3% |
| Alaskan Athabascans | 0.3 /100 | #252 | Tragic 7.3% |
| Cajuns | 0.3 /100 | #253 | Tragic 7.3% |
| Immigrants | Ecuador | 0.3 /100 | #254 | Tragic 7.3% |
| Mexican American Indians | 0.2 /100 | #255 | Tragic 7.4% |
| Seminole | 0.2 /100 | #256 | Tragic 7.4% |
| Alaska Natives | 0.2 /100 | #257 | Tragic 7.4% |
| Pueblo | 0.2 /100 | #258 | Tragic 7.4% |
| Immigrants | Yemen | 0.2 /100 | #259 | Tragic 7.4% |
| Immigrants | Zaire | 0.2 /100 | #260 | Tragic 7.4% |
| Japanese | 0.2 /100 | #261 | Tragic 7.4% |