Immigrants from Panama vs Immigrants from Dominica Poverty
COMPARE
Immigrants from Panama
Immigrants from Dominica
Poverty
Poverty Comparison
Immigrants from Panama
Immigrants from Dominica
13.3%
POVERTY
4.1/ 100
METRIC RATING
213th/ 347
METRIC RANK
16.1%
POVERTY
0.0/ 100
METRIC RATING
318th/ 347
METRIC RANK
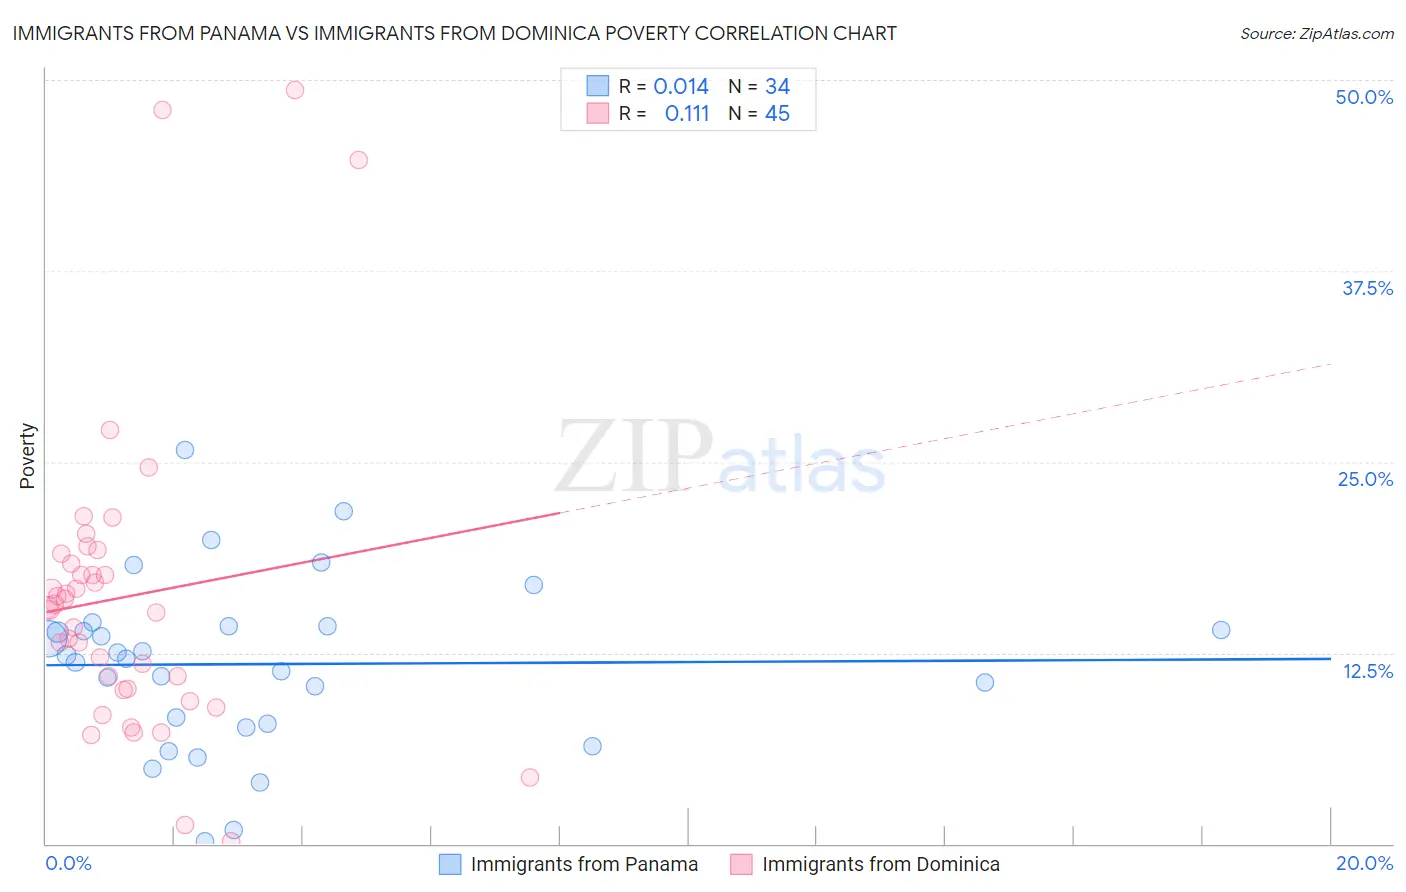
Immigrants from Panama vs Immigrants from Dominica Poverty Correlation Chart
The statistical analysis conducted on geographies consisting of 221,154,793 people shows no correlation between the proportion of Immigrants from Panama and poverty level in the United States with a correlation coefficient (R) of 0.014 and weighted average of 13.3%. Similarly, the statistical analysis conducted on geographies consisting of 83,789,226 people shows a poor positive correlation between the proportion of Immigrants from Dominica and poverty level in the United States with a correlation coefficient (R) of 0.111 and weighted average of 16.1%, a difference of 21.4%.
Poverty Correlation Summary
| Measurement | Immigrants from Panama | Immigrants from Dominica |
| Minimum | 0.14% | 0.13% |
| Maximum | 25.8% | 49.3% |
| Range | 25.7% | 49.2% |
| Mean | 11.8% | 16.2% |
| Median | 12.2% | 15.5% |
| Interquartile 25% (IQ1) | 7.9% | 10.1% |
| Interquartile 75% (IQ3) | 14.2% | 18.7% |
| Interquartile Range (IQR) | 6.4% | 8.6% |
| Standard Deviation (Sample) | 5.6% | 10.1% |
| Standard Deviation (Population) | 5.5% | 10.0% |
Similar Demographics by Poverty
Demographics Similar to Immigrants from Panama by Poverty
In terms of poverty, the demographic groups most similar to Immigrants from Panama are Immigrants (13.2%, a difference of 0.13%), Bermudan (13.3%, a difference of 0.25%), Japanese (13.3%, a difference of 0.51%), Nonimmigrants (13.3%, a difference of 0.51%), and Immigrants from Uzbekistan (13.3%, a difference of 0.55%).
| Demographics | Rating | Rank | Poverty |
| Immigrants | Eastern Africa | 7.0 /100 | #206 | Tragic 13.1% |
| Panamanians | 6.6 /100 | #207 | Tragic 13.1% |
| Ugandans | 6.2 /100 | #208 | Tragic 13.1% |
| Malaysians | 6.1 /100 | #209 | Tragic 13.1% |
| Immigrants | Azores | 6.1 /100 | #210 | Tragic 13.1% |
| Moroccans | 5.2 /100 | #211 | Tragic 13.2% |
| Immigrants | Immigrants | 4.3 /100 | #212 | Tragic 13.2% |
| Immigrants | Panama | 4.1 /100 | #213 | Tragic 13.3% |
| Bermudans | 3.7 /100 | #214 | Tragic 13.3% |
| Japanese | 3.3 /100 | #215 | Tragic 13.3% |
| Immigrants | Nonimmigrants | 3.3 /100 | #216 | Tragic 13.3% |
| Immigrants | Uzbekistan | 3.2 /100 | #217 | Tragic 13.3% |
| Immigrants | Thailand | 3.1 /100 | #218 | Tragic 13.3% |
| Immigrants | Cambodia | 3.0 /100 | #219 | Tragic 13.4% |
| Americans | 2.9 /100 | #220 | Tragic 13.4% |
Demographics Similar to Immigrants from Dominica by Poverty
In terms of poverty, the demographic groups most similar to Immigrants from Dominica are Immigrants from Congo (16.1%, a difference of 0.20%), U.S. Virgin Islander (16.1%, a difference of 0.29%), Immigrants from Honduras (16.2%, a difference of 0.43%), Arapaho (16.3%, a difference of 1.2%), and British West Indian (15.9%, a difference of 1.5%).
| Demographics | Rating | Rank | Poverty |
| Chippewa | 0.0 /100 | #311 | Tragic 15.7% |
| Cajuns | 0.0 /100 | #312 | Tragic 15.7% |
| Immigrants | Grenada | 0.0 /100 | #313 | Tragic 15.8% |
| Immigrants | Somalia | 0.0 /100 | #314 | Tragic 15.8% |
| British West Indians | 0.0 /100 | #315 | Tragic 15.9% |
| Hondurans | 0.0 /100 | #316 | Tragic 15.9% |
| U.S. Virgin Islanders | 0.0 /100 | #317 | Tragic 16.1% |
| Immigrants | Dominica | 0.0 /100 | #318 | Tragic 16.1% |
| Immigrants | Congo | 0.0 /100 | #319 | Tragic 16.1% |
| Immigrants | Honduras | 0.0 /100 | #320 | Tragic 16.2% |
| Arapaho | 0.0 /100 | #321 | Tragic 16.3% |
| Menominee | 0.0 /100 | #322 | Tragic 16.4% |
| Colville | 0.0 /100 | #323 | Tragic 16.6% |
| Yakama | 0.0 /100 | #324 | Tragic 16.7% |
| Central American Indians | 0.0 /100 | #325 | Tragic 16.7% |