Immigrants from Ecuador vs Houma Single Female Poverty
COMPARE
Immigrants from Ecuador
Houma
Single Female Poverty
Single Female Poverty Comparison
Immigrants from Ecuador
Houma
22.0%
SINGLE FEMALE POVERTY
4.2/ 100
METRIC RATING
236th/ 347
METRIC RANK
33.8%
SINGLE FEMALE POVERTY
0.0/ 100
METRIC RATING
345th/ 347
METRIC RANK
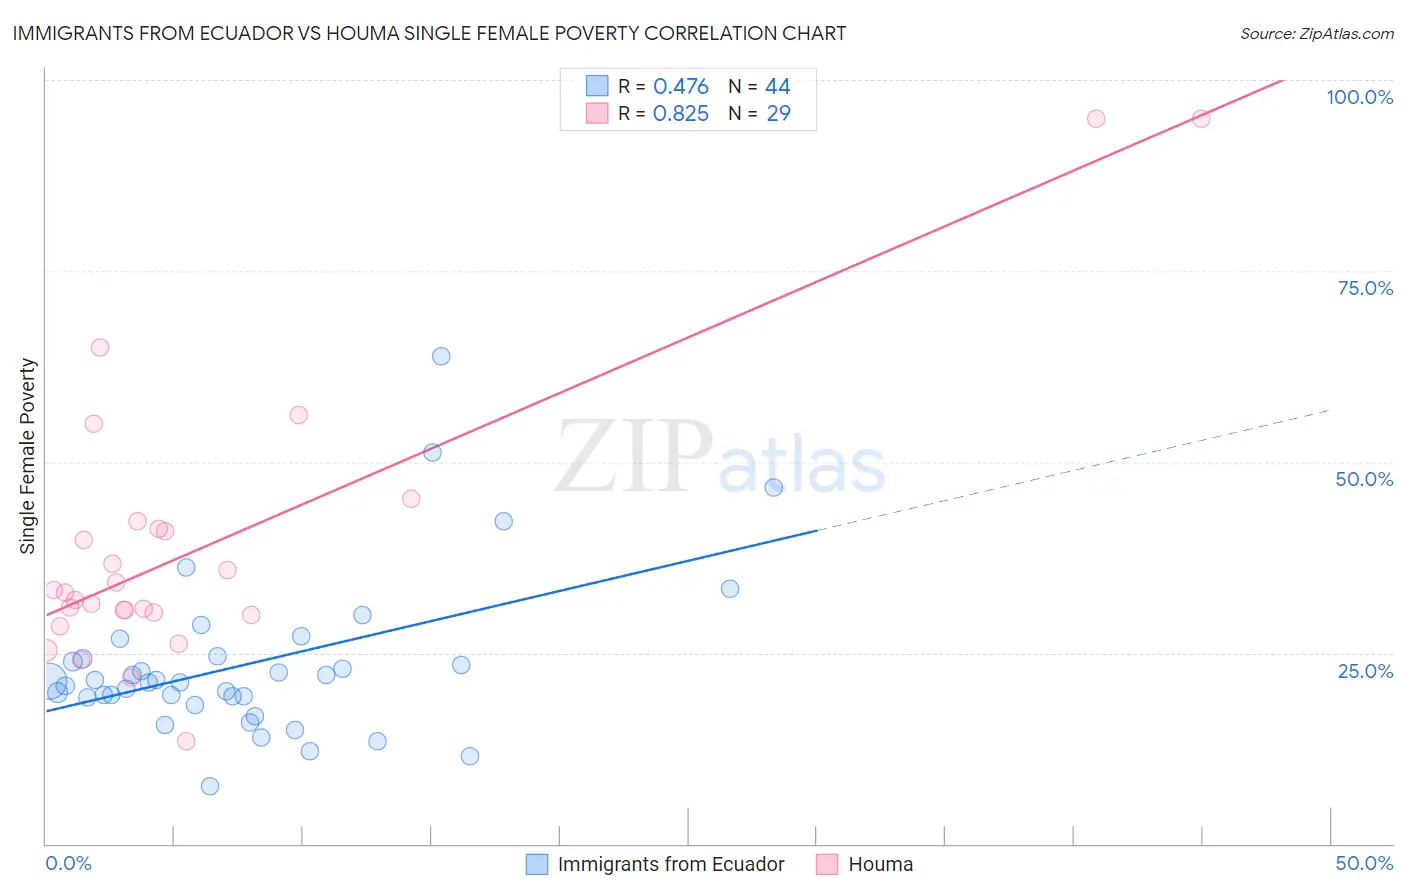
Immigrants from Ecuador vs Houma Single Female Poverty Correlation Chart
The statistical analysis conducted on geographies consisting of 268,226,949 people shows a moderate positive correlation between the proportion of Immigrants from Ecuador and poverty level among single females in the United States with a correlation coefficient (R) of 0.476 and weighted average of 22.0%. Similarly, the statistical analysis conducted on geographies consisting of 36,729,698 people shows a very strong positive correlation between the proportion of Houma and poverty level among single females in the United States with a correlation coefficient (R) of 0.825 and weighted average of 33.8%, a difference of 53.4%.
Single Female Poverty Correlation Summary
| Measurement | Immigrants from Ecuador | Houma |
| Minimum | 7.6% | 13.4% |
| Maximum | 63.8% | 94.8% |
| Range | 56.2% | 81.5% |
| Mean | 23.6% | 39.1% |
| Median | 21.2% | 33.0% |
| Interquartile 25% (IQ1) | 19.2% | 30.1% |
| Interquartile 75% (IQ3) | 24.4% | 41.8% |
| Interquartile Range (IQR) | 5.2% | 11.6% |
| Standard Deviation (Sample) | 10.6% | 18.7% |
| Standard Deviation (Population) | 10.5% | 18.4% |
Similar Demographics by Single Female Poverty
Demographics Similar to Immigrants from Ecuador by Single Female Poverty
In terms of single female poverty, the demographic groups most similar to Immigrants from Ecuador are Vietnamese (22.0%, a difference of 0.070%), Dutch (22.0%, a difference of 0.16%), Spaniard (22.0%, a difference of 0.18%), Spanish (22.0%, a difference of 0.18%), and Immigrants from Thailand (22.0%, a difference of 0.28%).
| Demographics | Rating | Rank | Single Female Poverty |
| Tlingit-Haida | 5.4 /100 | #229 | Tragic 21.9% |
| Immigrants | Western Africa | 5.3 /100 | #230 | Tragic 22.0% |
| Welsh | 5.0 /100 | #231 | Tragic 22.0% |
| Immigrants | Thailand | 5.0 /100 | #232 | Tragic 22.0% |
| Spaniards | 4.7 /100 | #233 | Tragic 22.0% |
| Spanish | 4.7 /100 | #234 | Tragic 22.0% |
| Dutch | 4.6 /100 | #235 | Tragic 22.0% |
| Immigrants | Ecuador | 4.2 /100 | #236 | Tragic 22.0% |
| Vietnamese | 4.0 /100 | #237 | Tragic 22.0% |
| French Canadians | 2.8 /100 | #238 | Tragic 22.2% |
| Malaysians | 2.8 /100 | #239 | Tragic 22.2% |
| French | 2.3 /100 | #240 | Tragic 22.2% |
| Cape Verdeans | 2.1 /100 | #241 | Tragic 22.3% |
| Bermudans | 2.0 /100 | #242 | Tragic 22.3% |
| West Indians | 1.9 /100 | #243 | Tragic 22.3% |
Demographics Similar to Houma by Single Female Poverty
In terms of single female poverty, the demographic groups most similar to Houma are Puerto Rican (34.1%, a difference of 0.92%), Tohono O'odham (34.2%, a difference of 1.2%), Lumbee (33.0%, a difference of 2.4%), Crow (32.4%, a difference of 4.3%), and Navajo (31.7%, a difference of 6.8%).
| Demographics | Rating | Rank | Single Female Poverty |
| Ute | 0.0 /100 | #333 | Tragic 28.4% |
| Pueblo | 0.0 /100 | #334 | Tragic 28.6% |
| Immigrants | Yemen | 0.0 /100 | #335 | Tragic 28.9% |
| Colville | 0.0 /100 | #336 | Tragic 29.1% |
| Yuman | 0.0 /100 | #337 | Tragic 29.4% |
| Pima | 0.0 /100 | #338 | Tragic 30.3% |
| Cheyenne | 0.0 /100 | #339 | Tragic 30.4% |
| Cajuns | 0.0 /100 | #340 | Tragic 30.6% |
| Sioux | 0.0 /100 | #341 | Tragic 31.3% |
| Navajo | 0.0 /100 | #342 | Tragic 31.7% |
| Crow | 0.0 /100 | #343 | Tragic 32.4% |
| Lumbee | 0.0 /100 | #344 | Tragic 33.0% |
| Houma | 0.0 /100 | #345 | Tragic 33.8% |
| Puerto Ricans | 0.0 /100 | #346 | Tragic 34.1% |
| Tohono O'odham | 0.0 /100 | #347 | Tragic 34.2% |