Immigrants from Western Africa vs Fijian Family Poverty
COMPARE
Immigrants from Western Africa
Fijian
Family Poverty
Family Poverty Comparison
Immigrants from Western Africa
Fijians
10.7%
FAMILY POVERTY
0.3/ 100
METRIC RATING
253rd/ 347
METRIC RANK
10.1%
FAMILY POVERTY
2.1/ 100
METRIC RATING
233rd/ 347
METRIC RANK
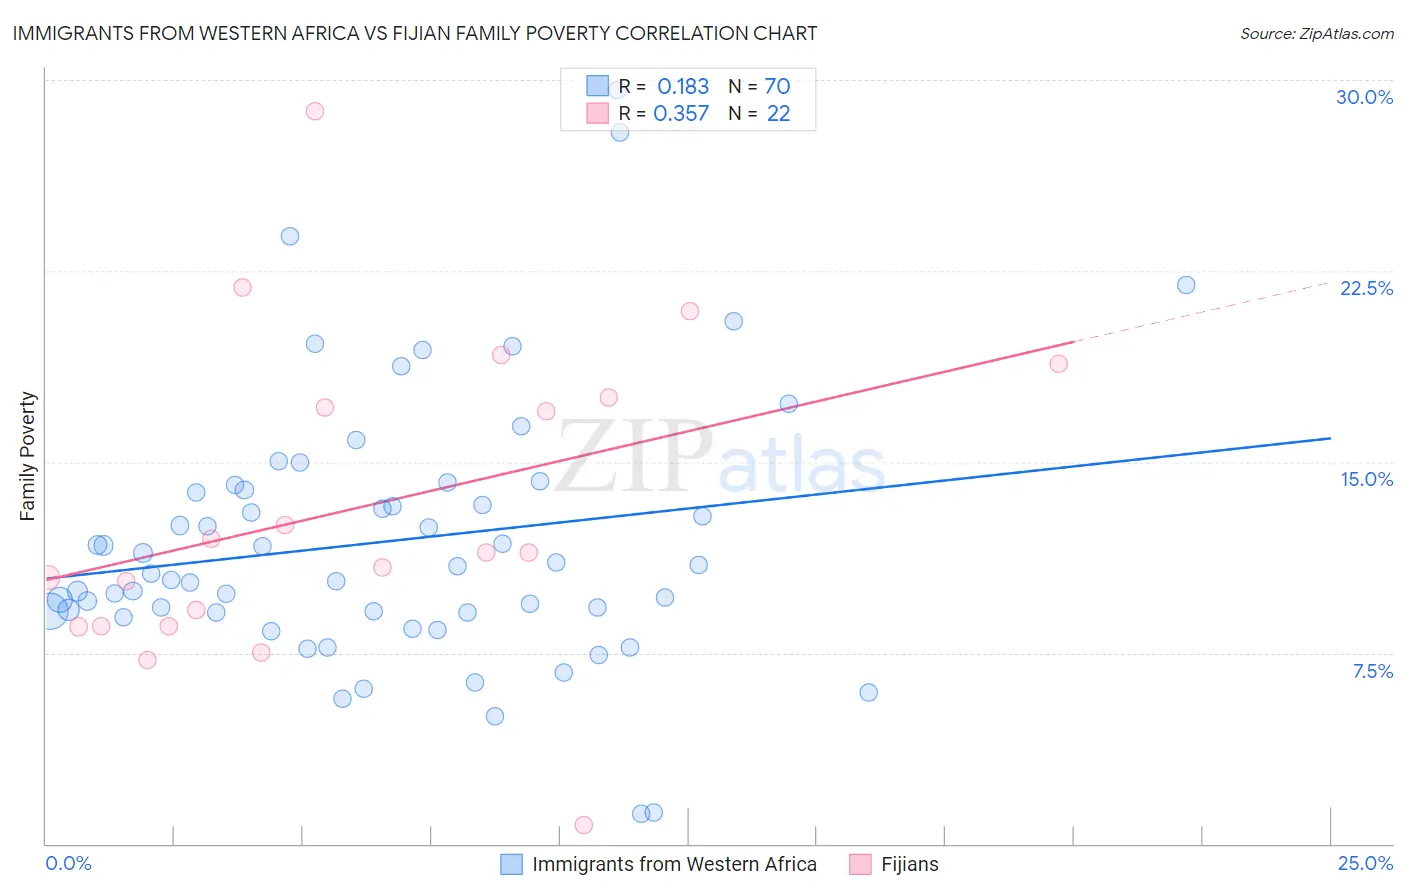
Immigrants from Western Africa vs Fijian Family Poverty Correlation Chart
The statistical analysis conducted on geographies consisting of 357,059,325 people shows a poor positive correlation between the proportion of Immigrants from Western Africa and poverty level among families in the United States with a correlation coefficient (R) of 0.183 and weighted average of 10.7%. Similarly, the statistical analysis conducted on geographies consisting of 55,925,682 people shows a mild positive correlation between the proportion of Fijians and poverty level among families in the United States with a correlation coefficient (R) of 0.357 and weighted average of 10.1%, a difference of 6.0%.
Family Poverty Correlation Summary
| Measurement | Immigrants from Western Africa | Fijian |
| Minimum | 1.2% | 0.73% |
| Maximum | 29.6% | 28.8% |
| Range | 28.4% | 28.0% |
| Mean | 11.9% | 13.2% |
| Median | 10.8% | 11.4% |
| Interquartile 25% (IQ1) | 9.1% | 8.6% |
| Interquartile 75% (IQ3) | 13.9% | 17.5% |
| Interquartile Range (IQR) | 4.8% | 8.9% |
| Standard Deviation (Sample) | 5.2% | 6.3% |
| Standard Deviation (Population) | 5.2% | 6.1% |
Demographics Similar to Immigrants from Western Africa and Fijians by Family Poverty
In terms of family poverty, the demographic groups most similar to Immigrants from Western Africa are Immigrants from Zaire (10.7%, a difference of 0.11%), Iroquois (10.7%, a difference of 0.23%), Salvadoran (10.7%, a difference of 0.51%), Cuban (10.6%, a difference of 1.0%), and Nicaraguan (10.6%, a difference of 1.1%). Similarly, the demographic groups most similar to Fijians are Immigrants from Middle Africa (10.1%, a difference of 0.11%), Nigerian (10.1%, a difference of 0.14%), Immigrants from Nigeria (10.2%, a difference of 0.39%), Immigrants from Laos (10.2%, a difference of 0.65%), and French American Indian (10.2%, a difference of 1.0%).
| Demographics | Rating | Rank | Family Poverty |
| Fijians | 2.1 /100 | #233 | Tragic 10.1% |
| Immigrants | Middle Africa | 2.1 /100 | #234 | Tragic 10.1% |
| Nigerians | 2.0 /100 | #235 | Tragic 10.1% |
| Immigrants | Nigeria | 1.9 /100 | #236 | Tragic 10.2% |
| Immigrants | Laos | 1.7 /100 | #237 | Tragic 10.2% |
| French American Indians | 1.5 /100 | #238 | Tragic 10.2% |
| Potawatomi | 1.5 /100 | #239 | Tragic 10.2% |
| Immigrants | Azores | 1.4 /100 | #240 | Tragic 10.3% |
| Ghanaians | 1.3 /100 | #241 | Tragic 10.3% |
| Alaska Natives | 1.0 /100 | #242 | Tragic 10.4% |
| Nepalese | 0.8 /100 | #243 | Tragic 10.4% |
| Cree | 0.7 /100 | #244 | Tragic 10.5% |
| Immigrants | Burma/Myanmar | 0.6 /100 | #245 | Tragic 10.5% |
| Cherokee | 0.5 /100 | #246 | Tragic 10.6% |
| Liberians | 0.4 /100 | #247 | Tragic 10.6% |
| Nicaraguans | 0.4 /100 | #248 | Tragic 10.6% |
| Cubans | 0.4 /100 | #249 | Tragic 10.6% |
| Salvadorans | 0.3 /100 | #250 | Tragic 10.7% |
| Iroquois | 0.3 /100 | #251 | Tragic 10.7% |
| Immigrants | Zaire | 0.3 /100 | #252 | Tragic 10.7% |
| Immigrants | Western Africa | 0.3 /100 | #253 | Tragic 10.7% |