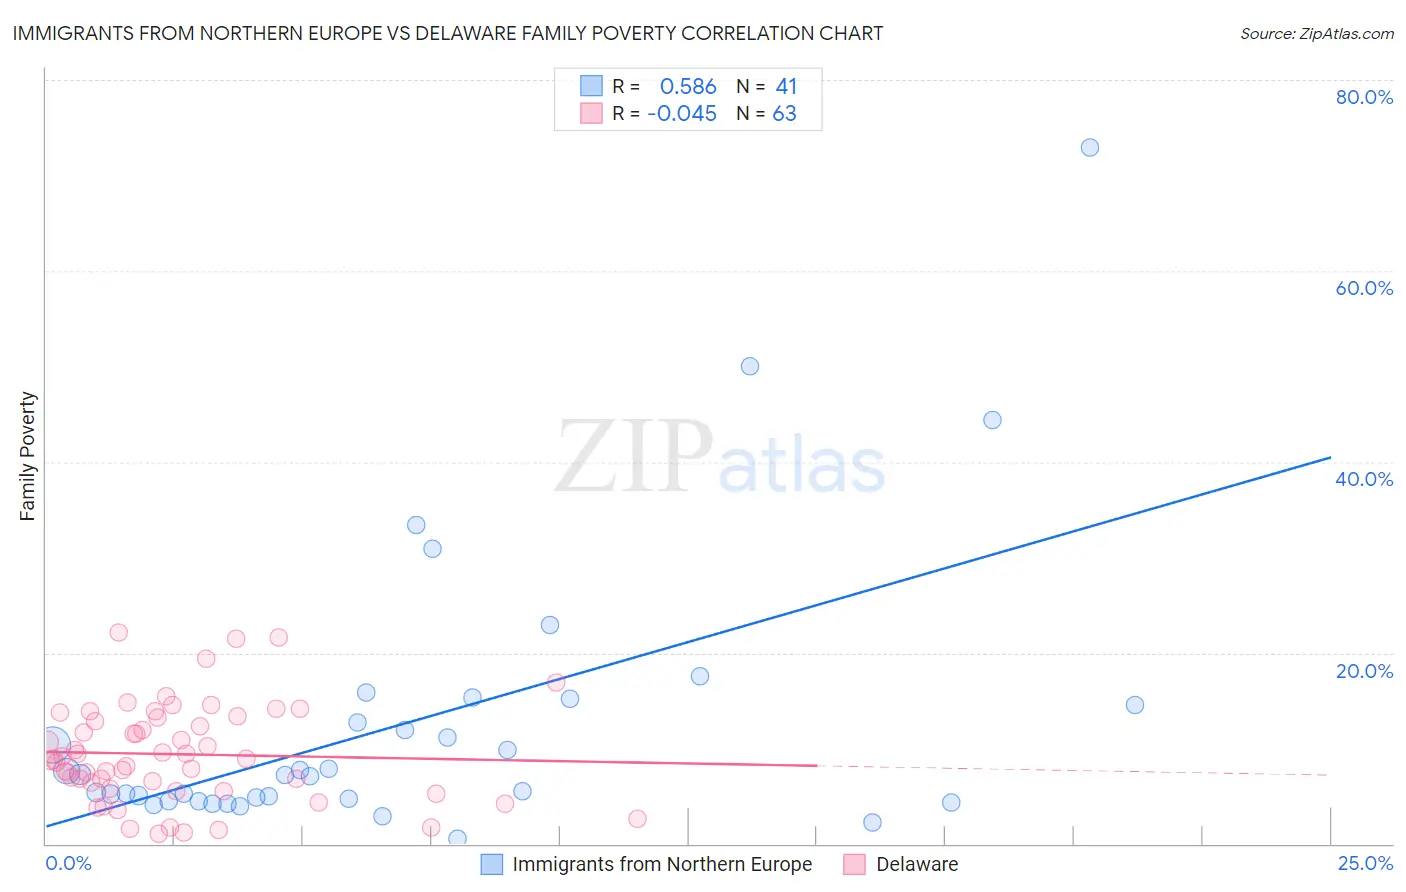
Immigrants from Northern Europe vs Delaware Family Poverty
COMPARE
Immigrants from Northern Europe
Delaware
Family Poverty
Family Poverty Comparison
Immigrants from Northern Europe
Delaware
7.4%
FAMILY POVERTY
99.6/ 100
METRIC RATING
29th/ 347
METRIC RANK
9.2%
FAMILY POVERTY
35.4/ 100
METRIC RATING
187th/ 347
METRIC RANK
Immigrants from Northern Europe vs Delaware Family Poverty Correlation Chart
The statistical analysis conducted on geographies consisting of 475,098,586 people shows a substantial positive correlation between the proportion of Immigrants from Northern Europe and poverty level among families in the United States with a correlation coefficient (R) of 0.586 and weighted average of 7.4%. Similarly, the statistical analysis conducted on geographies consisting of 96,157,993 people shows no correlation between the proportion of Delaware and poverty level among families in the United States with a correlation coefficient (R) of -0.045 and weighted average of 9.2%, a difference of 24.4%.
Family Poverty Correlation Summary
| Measurement | Immigrants from Northern Europe | Delaware |
| Minimum | 0.50% | 1.0% |
| Maximum | 72.9% | 22.1% |
| Range | 72.4% | 21.0% |
| Mean | 12.6% | 9.4% |
| Median | 7.3% | 8.8% |
| Interquartile 25% (IQ1) | 4.6% | 5.7% |
| Interquartile 75% (IQ3) | 14.9% | 13.2% |
| Interquartile Range (IQR) | 10.3% | 7.4% |
| Standard Deviation (Sample) | 14.6% | 5.1% |
| Standard Deviation (Population) | 14.4% | 5.1% |
Similar Demographics by Family Poverty
Demographics Similar to Immigrants from Northern Europe by Family Poverty
In terms of family poverty, the demographic groups most similar to Immigrants from Northern Europe are Immigrants from Korea (7.4%, a difference of 0.17%), Italian (7.4%, a difference of 0.29%), Czech (7.4%, a difference of 0.41%), Immigrants from Scotland (7.3%, a difference of 0.55%), and Cypriot (7.3%, a difference of 0.57%).
| Demographics | Rating | Rank | Family Poverty |
| Danes | 99.7 /100 | #22 | Exceptional 7.3% |
| Assyrians/Chaldeans/Syriacs | 99.7 /100 | #23 | Exceptional 7.3% |
| Croatians | 99.7 /100 | #24 | Exceptional 7.3% |
| Burmese | 99.7 /100 | #25 | Exceptional 7.3% |
| Cypriots | 99.6 /100 | #26 | Exceptional 7.3% |
| Immigrants | Scotland | 99.6 /100 | #27 | Exceptional 7.3% |
| Immigrants | Korea | 99.6 /100 | #28 | Exceptional 7.4% |
| Immigrants | Northern Europe | 99.6 /100 | #29 | Exceptional 7.4% |
| Italians | 99.6 /100 | #30 | Exceptional 7.4% |
| Czechs | 99.6 /100 | #31 | Exceptional 7.4% |
| Poles | 99.5 /100 | #32 | Exceptional 7.4% |
| Immigrants | Japan | 99.5 /100 | #33 | Exceptional 7.4% |
| Russians | 99.5 /100 | #34 | Exceptional 7.5% |
| Greeks | 99.4 /100 | #35 | Exceptional 7.5% |
| Turks | 99.4 /100 | #36 | Exceptional 7.5% |
Demographics Similar to Delaware by Family Poverty
In terms of family poverty, the demographic groups most similar to Delaware are Colombian (9.2%, a difference of 0.090%), Immigrants from Kenya (9.2%, a difference of 0.20%), Immigrants from Saudi Arabia (9.1%, a difference of 0.44%), South American Indian (9.1%, a difference of 0.45%), and Immigrants from Afghanistan (9.2%, a difference of 0.48%).
| Demographics | Rating | Rank | Family Poverty |
| Immigrants | Uganda | 43.4 /100 | #180 | Average 9.1% |
| Hmong | 40.2 /100 | #181 | Average 9.1% |
| Immigrants | Morocco | 40.2 /100 | #182 | Average 9.1% |
| Uruguayans | 39.2 /100 | #183 | Fair 9.1% |
| South American Indians | 38.7 /100 | #184 | Fair 9.1% |
| Immigrants | Saudi Arabia | 38.6 /100 | #185 | Fair 9.1% |
| Colombians | 36.1 /100 | #186 | Fair 9.2% |
| Delaware | 35.4 /100 | #187 | Fair 9.2% |
| Immigrants | Kenya | 34.0 /100 | #188 | Fair 9.2% |
| Immigrants | Afghanistan | 32.1 /100 | #189 | Fair 9.2% |
| Arabs | 31.5 /100 | #190 | Fair 9.2% |
| Ugandans | 28.7 /100 | #191 | Fair 9.3% |
| Spanish | 28.7 /100 | #192 | Fair 9.3% |
| Immigrants | Western Asia | 28.2 /100 | #193 | Fair 9.3% |
| South Americans | 28.1 /100 | #194 | Fair 9.3% |