Samoan vs Carpatho Rusyn Receiving Food Stamps

COMPARE

Samoan
Race
Ancestry
AfghanAfricanAlaska NativeAlaskan AthabascanAlbanianAleutAlsatianAmericanApacheArabArapahoArgentineanArmenianAssyrian/Chaldean/SyriacAustralianAustrianBahamianBangladeshiBarbadianBasqueBelgianBelizeanBermudanBhutaneseBlackfeetBolivianBrazilianBritishBritish West IndianBulgarianBurmeseCajunCambodianCanadianCape VerdeanCelticCentral AmericanCentral American IndianCherokeeCheyenneChickasawChileanChineseChippewaChoctawColombianColvilleComancheCosta RicanCreeCreekCroatianCrowCubanCypriotCzechCzechoslovakianDanishDelawareDominicanDutchDutch West IndianEastern EuropeanEcuadorianEgyptianEnglishEstonianEthiopianEuropeanFijianFilipinoFinnishFrenchFrench American IndianFrench CanadianGermanGerman RussianGhanaianGreekGuamanian/ChamorroGuatemalanGuyaneseHaitianHmongHonduranHopiHoumaHungarianIcelanderIndian (Asian)IndonesianInupiatIranianIraqiIrishIroquoisIsraeliItalianJamaicanJapaneseJordanianKenyanKiowaKoreanLaotianLatvianLebaneseLiberianLithuanianLumbeeLuxembourgerMacedonianMalaysianMalteseMarshalleseMenomineeMexicanMexican American IndianMongolianMoroccanNative HawaiianNavajoNepaleseNew ZealanderNicaraguanNigerianNorthern EuropeanNorwegianOkinawanOsageOttawaPaiutePakistaniPalestinianPanamanianParaguayanPennsylvania GermanPeruvianPimaPolishPortuguesePotawatomiPuebloPuerto RicanPuget Sound SalishRomanianRussianSalvadoranSamoanScandinavianScotch-IrishScottishSeminoleSenegaleseSerbianShoshoneSierra LeoneanSiouxSlavicSlovakSloveneSomaliSouth AfricanSouth AmericanSouth American IndianSoviet UnionSpaniardSpanishSpanish AmericanSpanish American IndianSri LankanSubsaharan AfricanSudaneseSwedishSwissSyrianTaiwaneseThaiTlingit-HaidaTohono O'OdhamTonganTrinidadian and TobagonianTsimshianTurkishU.S. Virgin IslanderUgandanUkrainianUruguayanUteVenezuelanVietnameseWelshWest IndianYakamaYaquiYugoslavianYumanYup'ikZimbabwean
Immigration
NonimmigrantsImmigrantsAfghanistanAfricaAlbaniaArgentinaArmeniaAsiaAustraliaAustriaBahamasBangladeshBarbadosBelarusBelgiumBelizeBoliviaBosnia and HerzegovinaBrazilBulgariaBurma/MyanmarCabo VerdeCambodiaCameroonCanadaCaribbeanCentral AmericaChileChinaColombiaCongoCosta RicaCroatiaCubaCzechoslovakiaDenmarkDominicaDominican RepublicEastern AfricaEastern AsiaEastern EuropeEcuadorEgyptEl SalvadorEnglandEritreaEthiopiaEuropeFijiFranceGermanyGhanaGreeceGrenadaGuatemalaGuyanaHaitiHondurasHong KongHungaryIndiaIndonesiaIranIraqIrelandIsraelItalyJamaicaJapanJordanKazakhstanKenyaKoreaKuwaitLaosLatin AmericaLatviaLebanonLiberiaLithuaniaMalaysiaMexicoMicronesiaMiddle AfricaMoldovaMoroccoNepalNetherlandsNicaraguaNigeriaNorth AmericaNorth MacedoniaNorthern AfricaNorthern EuropeNorwayOceaniaPakistanPanamaPeruPhilippinesPolandPortugalRomaniaRussiaSaudi ArabiaScotlandSenegalSerbiaSierra LeoneSingaporeSomaliaSouth AfricaSouth AmericaSouth Central AsiaSouth Eastern AsiaSouthern EuropeSpainSri LankaSt. Vincent and the GrenadinesSudanSwedenSwitzerlandSyriaTaiwanThailandTrinidad and TobagoTurkeyUgandaUkraineUruguayUzbekistanVenezuelaVietnamWest IndiesWestern AfricaWestern AsiaWestern EuropeYemenZaireZimbabweAzores
Carpatho Rusyn
Race
Ancestry
AfghanAfricanAlaska NativeAlaskan AthabascanAlbanianAleutAlsatianAmericanApacheArabArapahoArgentineanArmenianAssyrian/Chaldean/SyriacAustralianAustrianBahamianBangladeshiBarbadianBasqueBelgianBelizeanBermudanBhutaneseBlackfeetBolivianBrazilianBritishBritish West IndianBulgarianBurmeseCajunCambodianCanadianCape VerdeanCarpatho RusynCelticCentral AmericanCentral American IndianCherokeeCheyenneChickasawChileanChineseChippewaChoctawColombianColvilleComancheCosta RicanCreeCreekCroatianCrowCubanCypriotCzechCzechoslovakianDanishDelawareDominicanDutchDutch West IndianEastern EuropeanEcuadorianEgyptianEnglishEstonianEthiopianEuropeanFijianFilipinoFinnishFrenchFrench American IndianFrench CanadianGermanGerman RussianGhanaianGreekGuamanian/ChamorroGuatemalanGuyaneseHaitianHmongHonduranHopiHoumaHungarianIcelanderIndian (Asian)IndonesianInupiatIranianIraqiIrishIroquoisIsraeliItalianJamaicanJapaneseJordanianKenyanKiowaKoreanLaotianLatvianLebaneseLiberianLithuanianLumbeeLuxembourgerMacedonianMalaysianMalteseMarshalleseMenomineeMexicanMexican American IndianMongolianMoroccanNative HawaiianNavajoNepaleseNew ZealanderNicaraguanNigerianNorthern EuropeanNorwegianOkinawanOsageOttawaPaiutePakistaniPalestinianPanamanianParaguayanPennsylvania GermanPeruvianPimaPolishPortuguesePotawatomiPuebloPuerto RicanPuget Sound SalishRomanianRussianSalvadoranScandinavianScotch-IrishScottishSeminoleSenegaleseSerbianShoshoneSierra LeoneanSiouxSlavicSlovakSloveneSomaliSouth AfricanSouth AmericanSouth American IndianSoviet UnionSpaniardSpanishSpanish AmericanSpanish American IndianSri LankanSubsaharan AfricanSudaneseSwedishSwissSyrianTaiwaneseThaiTlingit-HaidaTohono O'OdhamTonganTrinidadian and TobagonianTsimshianTurkishU.S. Virgin IslanderUgandanUkrainianUruguayanUteVenezuelanVietnameseWelshWest IndianYakamaYaquiYugoslavianYumanYup'ikZimbabwean
Immigration
NonimmigrantsImmigrantsAfghanistanAfricaAlbaniaArgentinaArmeniaAsiaAustraliaAustriaBahamasBangladeshBarbadosBelarusBelgiumBelizeBoliviaBosnia and HerzegovinaBrazilBulgariaBurma/MyanmarCabo VerdeCambodiaCameroonCanadaCaribbeanCentral AmericaChileChinaColombiaCongoCosta RicaCroatiaCubaCzechoslovakiaDenmarkDominicaDominican RepublicEastern AfricaEastern AsiaEastern EuropeEcuadorEgyptEl SalvadorEnglandEritreaEthiopiaEuropeFijiFranceGermanyGhanaGreeceGrenadaGuatemalaGuyanaHaitiHondurasHong KongHungaryIndiaIndonesiaIranIraqIrelandIsraelItalyJamaicaJapanJordanKazakhstanKenyaKoreaKuwaitLaosLatin AmericaLatviaLebanonLiberiaLithuaniaMalaysiaMexicoMicronesiaMiddle AfricaMoldovaMoroccoNepalNetherlandsNicaraguaNigeriaNorth AmericaNorth MacedoniaNorthern AfricaNorthern EuropeNorwayOceaniaPakistanPanamaPeruPhilippinesPolandPortugalRomaniaRussiaSaudi ArabiaScotlandSenegalSerbiaSierra LeoneSingaporeSomaliaSouth AfricaSouth AmericaSouth Central AsiaSouth Eastern AsiaSouthern EuropeSpainSri LankaSt. Vincent and the GrenadinesSudanSwedenSwitzerlandSyriaTaiwanThailandTrinidad and TobagoTurkeyUgandaUkraineUruguayUzbekistanVenezuelaVietnamWest IndiesWestern AfricaWestern AsiaWestern EuropeYemenZaireZimbabweAzores
Receiving Food Stamps
Income
Poverty
Unemployment
Labor Participation
Family Structure
Vehicle Availability
Education Level
Disability

Receiving Food Stamps Comparison

Samoans

Carpatho Rusyns

Fair
Exceptional
12.1%
RECEIVING FOOD STAMPS
31.0/ 100
METRIC RATING
192nd/ 347
METRIC RANK
10.4%
RECEIVING FOOD STAMPS
96.2/ 100
METRIC RATING
108th/ 347
METRIC RANK

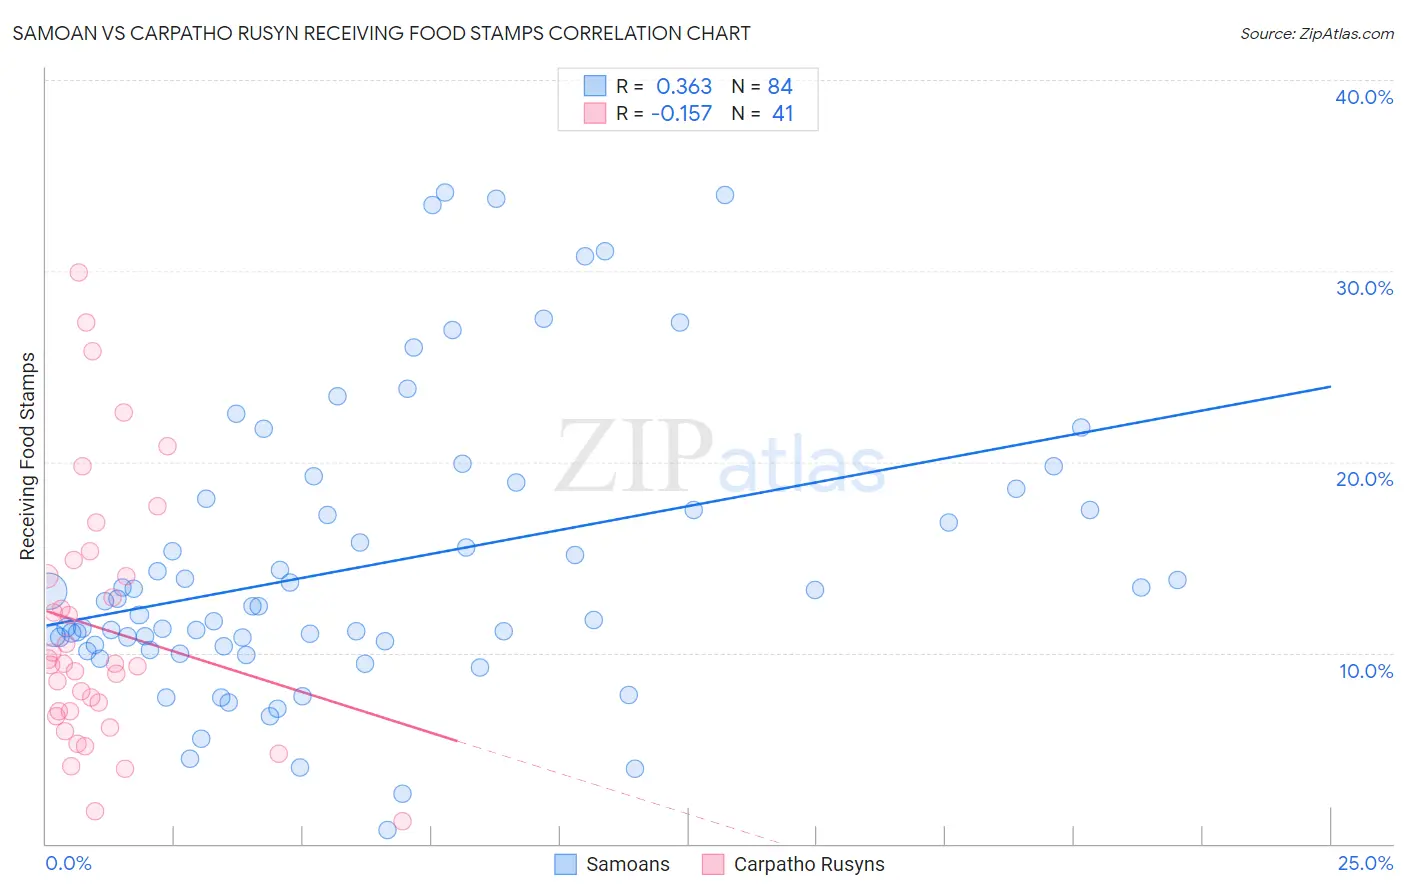
Samoan vs Carpatho Rusyn Receiving Food Stamps Correlation Chart

The statistical analysis conducted on geographies consisting of 224,983,999 people shows a mild positive correlation between the proportion of Samoans and percentage of population receiving government assistance and/or food stamps in the United States with a correlation coefficient (R) of 0.363 and weighted average of 12.1%. Similarly, the statistical analysis conducted on geographies consisting of 58,758,722 people shows a poor negative correlation between the proportion of Carpatho Rusyns and percentage of population receiving government assistance and/or food stamps in the United States with a correlation coefficient (R) of -0.157 and weighted average of 10.4%, a difference of 16.0%.
Samoan vs Carpatho Rusyn Receiving Food Stamps

Receiving Food Stamps Correlation Summary

MeasurementSamoanCarpatho Rusyn
Minimum0.70%1.2%
Maximum34.1%29.9%
Range33.4%28.7%
Mean14.6%11.3%
Median12.4%9.4%
Interquartile 25% (IQ1)10.4%6.8%
Interquartile 75% (IQ3)17.8%14.4%
Interquartile Range (IQR)7.4%7.6%
Standard Deviation (Sample)7.5%6.8%
Standard Deviation (Population)7.5%6.7%

Similar Demographics by Receiving Food Stamps

Demographics Similar to Samoans by Receiving Food Stamps

In terms of receiving food stamps, the demographic groups most similar to Samoans are Venezuelan (12.0%, a difference of 0.18%), Immigrants from Peru (12.0%, a difference of 0.19%), Immigrants from Cameroon (12.0%, a difference of 0.24%), Sudanese (12.0%, a difference of 0.38%), and Immigrants from Fiji (12.1%, a difference of 0.53%).
DemographicsRating | RankReceiving Food Stamps
Immigrants | Iraq
37.1
/100
|
#185
Fair
12.0%
Spanish
36.9
/100
|
#186
Fair
12.0%
Albanians
35.4
/100
|
#187
Fair
12.0%
Sudanese
33.4
/100
|
#188
Fair
12.0%
Immigrants | Cameroon
32.5
/100
|
#189
Fair
12.0%
Immigrants | Peru
32.2
/100
|
#190
Fair
12.0%
Venezuelans
32.1
/100
|
#191
Fair
12.0%
Samoans
31.0
/100
|
#192
Fair
12.1%
Immigrants | Fiji
27.8
/100
|
#193
Fair
12.1%
Immigrants | Sudan
27.1
/100
|
#194
Fair
12.1%
Americans
26.7
/100
|
#195
Fair
12.2%
Iraqis
26.6
/100
|
#196
Fair
12.2%
Delaware
26.1
/100
|
#197
Fair
12.2%
Immigrants | Costa Rica
25.4
/100
|
#198
Fair
12.2%
Portuguese
25.1
/100
|
#199
Fair
12.2%

Demographics Similar to Carpatho Rusyns by Receiving Food Stamps

In terms of receiving food stamps, the demographic groups most similar to Carpatho Rusyns are Korean (10.4%, a difference of 0.030%), Immigrants from Pakistan (10.4%, a difference of 0.040%), Immigrants from Italy (10.4%, a difference of 0.19%), Immigrants from Malaysia (10.4%, a difference of 0.27%), and Pakistani (10.4%, a difference of 0.33%).
DemographicsRating | RankReceiving Food Stamps
Palestinians
96.9
/100
|
#101
Exceptional
10.3%
Immigrants | Europe
96.8
/100
|
#102
Exceptional
10.3%
Immigrants | Latvia
96.8
/100
|
#103
Exceptional
10.3%
Immigrants | Hungary
96.7
/100
|
#104
Exceptional
10.3%
Immigrants | Malaysia
96.5
/100
|
#105
Exceptional
10.4%
Immigrants | Italy
96.4
/100
|
#106
Exceptional
10.4%
Koreans
96.3
/100
|
#107
Exceptional
10.4%
Carpatho Rusyns
96.2
/100
|
#108
Exceptional
10.4%
Immigrants | Pakistan
96.2
/100
|
#109
Exceptional
10.4%
Pakistanis
95.9
/100
|
#110
Exceptional
10.4%
Romanians
95.8
/100
|
#111
Exceptional
10.4%
Mongolians
95.8
/100
|
#112
Exceptional
10.5%
Icelanders
95.4
/100
|
#113
Exceptional
10.5%
Scotch-Irish
95.1
/100
|
#114
Exceptional
10.5%
Immigrants | Saudi Arabia
94.9
/100
|
#115
Exceptional
10.5%