White/Caucasian vs Carpatho Rusyn Receiving Food Stamps
COMPARE
White/Caucasian
Carpatho Rusyn
Receiving Food Stamps
Receiving Food Stamps Comparison
Whites/Caucasians
Carpatho Rusyns
11.1%
RECEIVING FOOD STAMPS
83.9/ 100
METRIC RATING
147th/ 347
METRIC RANK
10.4%
RECEIVING FOOD STAMPS
96.2/ 100
METRIC RATING
108th/ 347
METRIC RANK
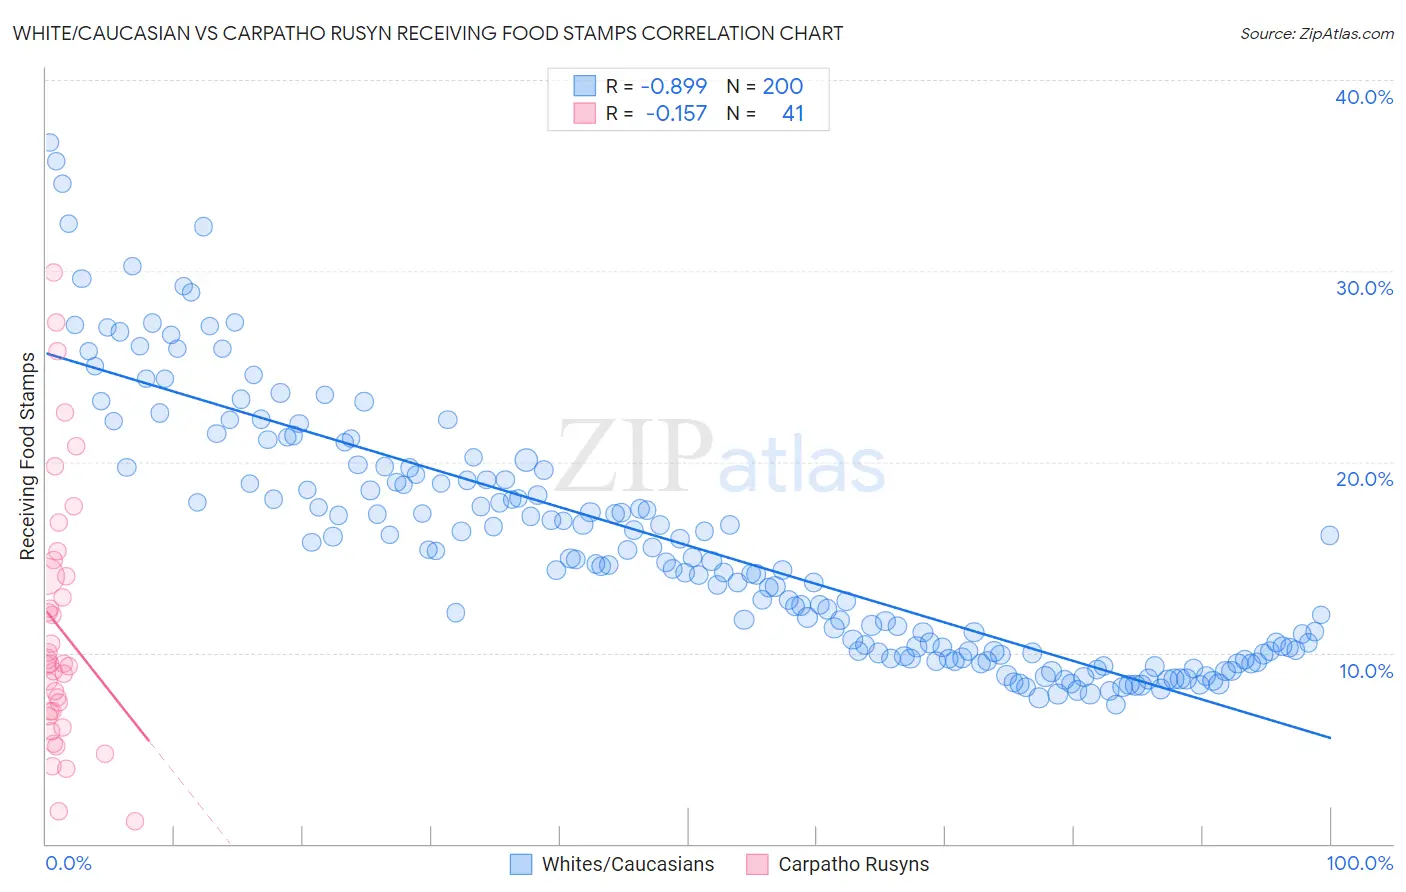
White/Caucasian vs Carpatho Rusyn Receiving Food Stamps Correlation Chart
The statistical analysis conducted on geographies consisting of 580,507,167 people shows a very strong negative correlation between the proportion of Whites/Caucasians and percentage of population receiving government assistance and/or food stamps in the United States with a correlation coefficient (R) of -0.899 and weighted average of 11.1%. Similarly, the statistical analysis conducted on geographies consisting of 58,758,722 people shows a poor negative correlation between the proportion of Carpatho Rusyns and percentage of population receiving government assistance and/or food stamps in the United States with a correlation coefficient (R) of -0.157 and weighted average of 10.4%, a difference of 6.3%.
Receiving Food Stamps Correlation Summary
| Measurement | White/Caucasian | Carpatho Rusyn |
| Minimum | 7.3% | 1.2% |
| Maximum | 36.7% | 29.9% |
| Range | 29.4% | 28.7% |
| Mean | 15.6% | 11.3% |
| Median | 14.5% | 9.4% |
| Interquartile 25% (IQ1) | 10.0% | 6.8% |
| Interquartile 75% (IQ3) | 19.1% | 14.4% |
| Interquartile Range (IQR) | 9.1% | 7.6% |
| Standard Deviation (Sample) | 6.5% | 6.8% |
| Standard Deviation (Population) | 6.5% | 6.7% |
Similar Demographics by Receiving Food Stamps
Demographics Similar to Whites/Caucasians by Receiving Food Stamps
In terms of receiving food stamps, the demographic groups most similar to Whites/Caucasians are Taiwanese (11.0%, a difference of 0.090%), Immigrants from South Eastern Asia (11.1%, a difference of 0.16%), Brazilian (11.1%, a difference of 0.18%), Soviet Union (11.1%, a difference of 0.21%), and Hungarian (11.0%, a difference of 0.34%).
| Demographics | Rating | Rank | Receiving Food Stamps |
| Celtics | 87.8 /100 | #140 | Excellent 10.9% |
| Immigrants | Vietnam | 86.7 /100 | #141 | Excellent 11.0% |
| Chileans | 86.2 /100 | #142 | Excellent 11.0% |
| Immigrants | Northern Africa | 86.0 /100 | #143 | Excellent 11.0% |
| Syrians | 85.5 /100 | #144 | Excellent 11.0% |
| Hungarians | 85.1 /100 | #145 | Excellent 11.0% |
| Taiwanese | 84.2 /100 | #146 | Excellent 11.0% |
| Whites/Caucasians | 83.9 /100 | #147 | Excellent 11.1% |
| Immigrants | South Eastern Asia | 83.3 /100 | #148 | Excellent 11.1% |
| Brazilians | 83.2 /100 | #149 | Excellent 11.1% |
| Soviet Union | 83.1 /100 | #150 | Excellent 11.1% |
| Immigrants | Spain | 81.7 /100 | #151 | Excellent 11.1% |
| Immigrants | Kazakhstan | 81.7 /100 | #152 | Excellent 11.1% |
| Lebanese | 81.6 /100 | #153 | Excellent 11.1% |
| Armenians | 81.4 /100 | #154 | Excellent 11.1% |
Demographics Similar to Carpatho Rusyns by Receiving Food Stamps
In terms of receiving food stamps, the demographic groups most similar to Carpatho Rusyns are Korean (10.4%, a difference of 0.030%), Immigrants from Pakistan (10.4%, a difference of 0.040%), Immigrants from Italy (10.4%, a difference of 0.19%), Immigrants from Malaysia (10.4%, a difference of 0.27%), and Pakistani (10.4%, a difference of 0.33%).
| Demographics | Rating | Rank | Receiving Food Stamps |
| Palestinians | 96.9 /100 | #101 | Exceptional 10.3% |
| Immigrants | Europe | 96.8 /100 | #102 | Exceptional 10.3% |
| Immigrants | Latvia | 96.8 /100 | #103 | Exceptional 10.3% |
| Immigrants | Hungary | 96.7 /100 | #104 | Exceptional 10.3% |
| Immigrants | Malaysia | 96.5 /100 | #105 | Exceptional 10.4% |
| Immigrants | Italy | 96.4 /100 | #106 | Exceptional 10.4% |
| Koreans | 96.3 /100 | #107 | Exceptional 10.4% |
| Carpatho Rusyns | 96.2 /100 | #108 | Exceptional 10.4% |
| Immigrants | Pakistan | 96.2 /100 | #109 | Exceptional 10.4% |
| Pakistanis | 95.9 /100 | #110 | Exceptional 10.4% |
| Romanians | 95.8 /100 | #111 | Exceptional 10.4% |
| Mongolians | 95.8 /100 | #112 | Exceptional 10.5% |
| Icelanders | 95.4 /100 | #113 | Exceptional 10.5% |
| Scotch-Irish | 95.1 /100 | #114 | Exceptional 10.5% |
| Immigrants | Saudi Arabia | 94.9 /100 | #115 | Exceptional 10.5% |