Immigrants from Argentina vs Carpatho Rusyn Receiving Food Stamps
COMPARE
Immigrants from Argentina
Carpatho Rusyn
Receiving Food Stamps
Receiving Food Stamps Comparison
Immigrants from Argentina
Carpatho Rusyns
11.2%
RECEIVING FOOD STAMPS
80.4/ 100
METRIC RATING
155th/ 347
METRIC RANK
10.4%
RECEIVING FOOD STAMPS
96.2/ 100
METRIC RATING
108th/ 347
METRIC RANK
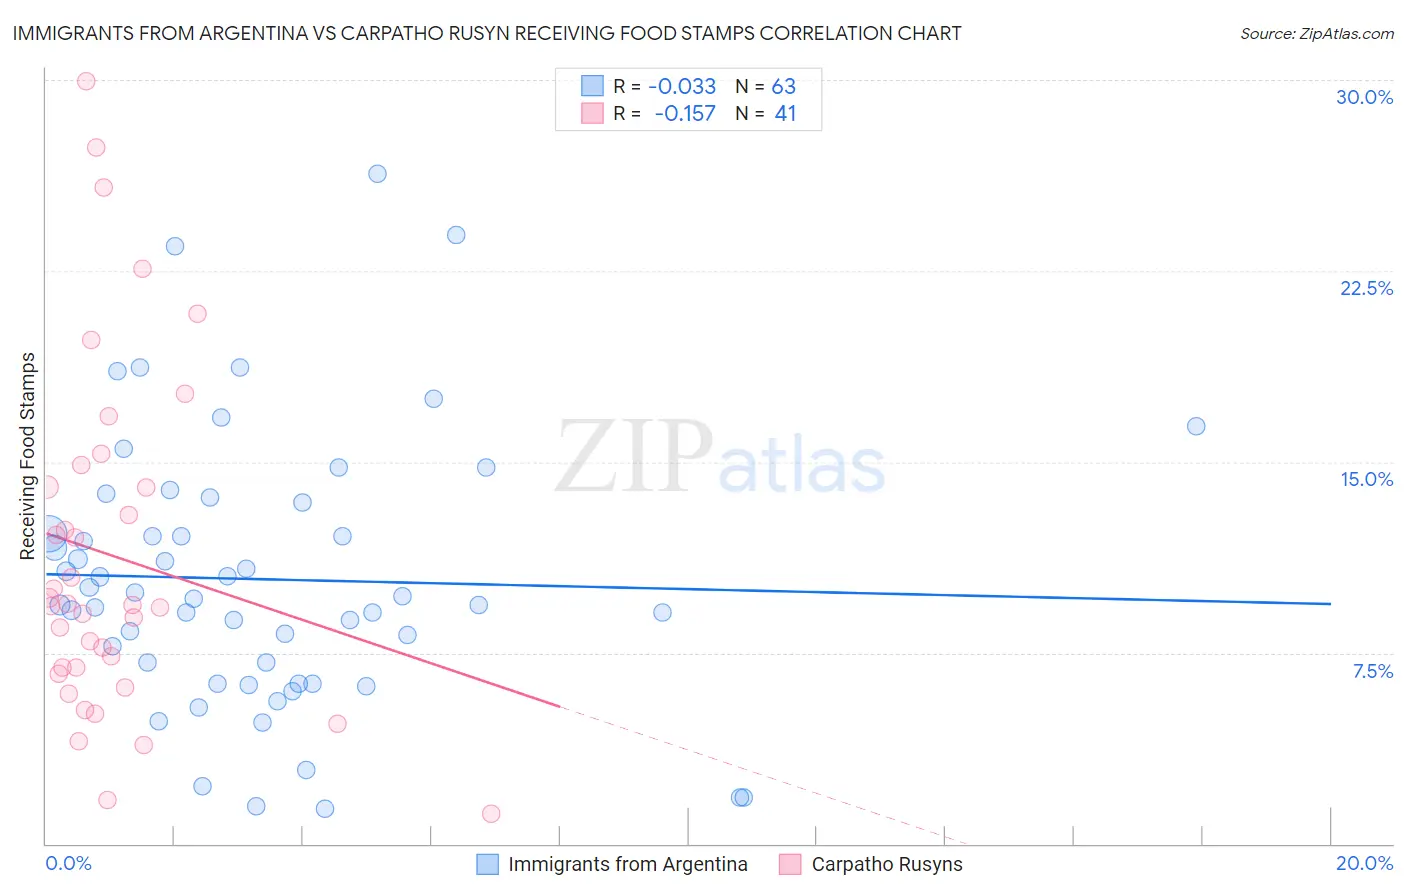
Immigrants from Argentina vs Carpatho Rusyn Receiving Food Stamps Correlation Chart
The statistical analysis conducted on geographies consisting of 263,859,241 people shows no correlation between the proportion of Immigrants from Argentina and percentage of population receiving government assistance and/or food stamps in the United States with a correlation coefficient (R) of -0.033 and weighted average of 11.2%. Similarly, the statistical analysis conducted on geographies consisting of 58,758,722 people shows a poor negative correlation between the proportion of Carpatho Rusyns and percentage of population receiving government assistance and/or food stamps in the United States with a correlation coefficient (R) of -0.157 and weighted average of 10.4%, a difference of 7.2%.
Receiving Food Stamps Correlation Summary
| Measurement | Immigrants from Argentina | Carpatho Rusyn |
| Minimum | 1.4% | 1.2% |
| Maximum | 26.3% | 29.9% |
| Range | 24.9% | 28.7% |
| Mean | 10.4% | 11.3% |
| Median | 9.6% | 9.4% |
| Interquartile 25% (IQ1) | 6.3% | 6.8% |
| Interquartile 75% (IQ3) | 13.4% | 14.4% |
| Interquartile Range (IQR) | 7.1% | 7.6% |
| Standard Deviation (Sample) | 5.3% | 6.8% |
| Standard Deviation (Population) | 5.3% | 6.7% |
Similar Demographics by Receiving Food Stamps
Demographics Similar to Immigrants from Argentina by Receiving Food Stamps
In terms of receiving food stamps, the demographic groups most similar to Immigrants from Argentina are Armenian (11.1%, a difference of 0.25%), Lebanese (11.1%, a difference of 0.31%), Immigrants from Spain (11.1%, a difference of 0.33%), Immigrants from Kazakhstan (11.1%, a difference of 0.33%), and Soviet Union (11.1%, a difference of 0.69%).
| Demographics | Rating | Rank | Receiving Food Stamps |
| Immigrants | South Eastern Asia | 83.3 /100 | #148 | Excellent 11.1% |
| Brazilians | 83.2 /100 | #149 | Excellent 11.1% |
| Soviet Union | 83.1 /100 | #150 | Excellent 11.1% |
| Immigrants | Spain | 81.7 /100 | #151 | Excellent 11.1% |
| Immigrants | Kazakhstan | 81.7 /100 | #152 | Excellent 11.1% |
| Lebanese | 81.6 /100 | #153 | Excellent 11.1% |
| Armenians | 81.4 /100 | #154 | Excellent 11.1% |
| Immigrants | Argentina | 80.4 /100 | #155 | Excellent 11.2% |
| Immigrants | Afghanistan | 75.6 /100 | #156 | Good 11.3% |
| Immigrants | Lebanon | 75.2 /100 | #157 | Good 11.3% |
| Immigrants | Bosnia and Herzegovina | 72.6 /100 | #158 | Good 11.3% |
| Immigrants | Oceania | 70.4 /100 | #159 | Good 11.4% |
| French Canadians | 69.5 /100 | #160 | Good 11.4% |
| Pennsylvania Germans | 68.4 /100 | #161 | Good 11.4% |
| Alsatians | 68.0 /100 | #162 | Good 11.4% |
Demographics Similar to Carpatho Rusyns by Receiving Food Stamps
In terms of receiving food stamps, the demographic groups most similar to Carpatho Rusyns are Korean (10.4%, a difference of 0.030%), Immigrants from Pakistan (10.4%, a difference of 0.040%), Immigrants from Italy (10.4%, a difference of 0.19%), Immigrants from Malaysia (10.4%, a difference of 0.27%), and Pakistani (10.4%, a difference of 0.33%).
| Demographics | Rating | Rank | Receiving Food Stamps |
| Palestinians | 96.9 /100 | #101 | Exceptional 10.3% |
| Immigrants | Europe | 96.8 /100 | #102 | Exceptional 10.3% |
| Immigrants | Latvia | 96.8 /100 | #103 | Exceptional 10.3% |
| Immigrants | Hungary | 96.7 /100 | #104 | Exceptional 10.3% |
| Immigrants | Malaysia | 96.5 /100 | #105 | Exceptional 10.4% |
| Immigrants | Italy | 96.4 /100 | #106 | Exceptional 10.4% |
| Koreans | 96.3 /100 | #107 | Exceptional 10.4% |
| Carpatho Rusyns | 96.2 /100 | #108 | Exceptional 10.4% |
| Immigrants | Pakistan | 96.2 /100 | #109 | Exceptional 10.4% |
| Pakistanis | 95.9 /100 | #110 | Exceptional 10.4% |
| Romanians | 95.8 /100 | #111 | Exceptional 10.4% |
| Mongolians | 95.8 /100 | #112 | Exceptional 10.5% |
| Icelanders | 95.4 /100 | #113 | Exceptional 10.5% |
| Scotch-Irish | 95.1 /100 | #114 | Exceptional 10.5% |
| Immigrants | Saudi Arabia | 94.9 /100 | #115 | Exceptional 10.5% |