Samoan vs Hopi Receiving Food Stamps
COMPARE
Samoan
Hopi
Receiving Food Stamps
Receiving Food Stamps Comparison
Samoans
Hopi
12.1%
RECEIVING FOOD STAMPS
31.0/ 100
METRIC RATING
192nd/ 347
METRIC RANK
21.6%
RECEIVING FOOD STAMPS
0.0/ 100
METRIC RATING
341st/ 347
METRIC RANK
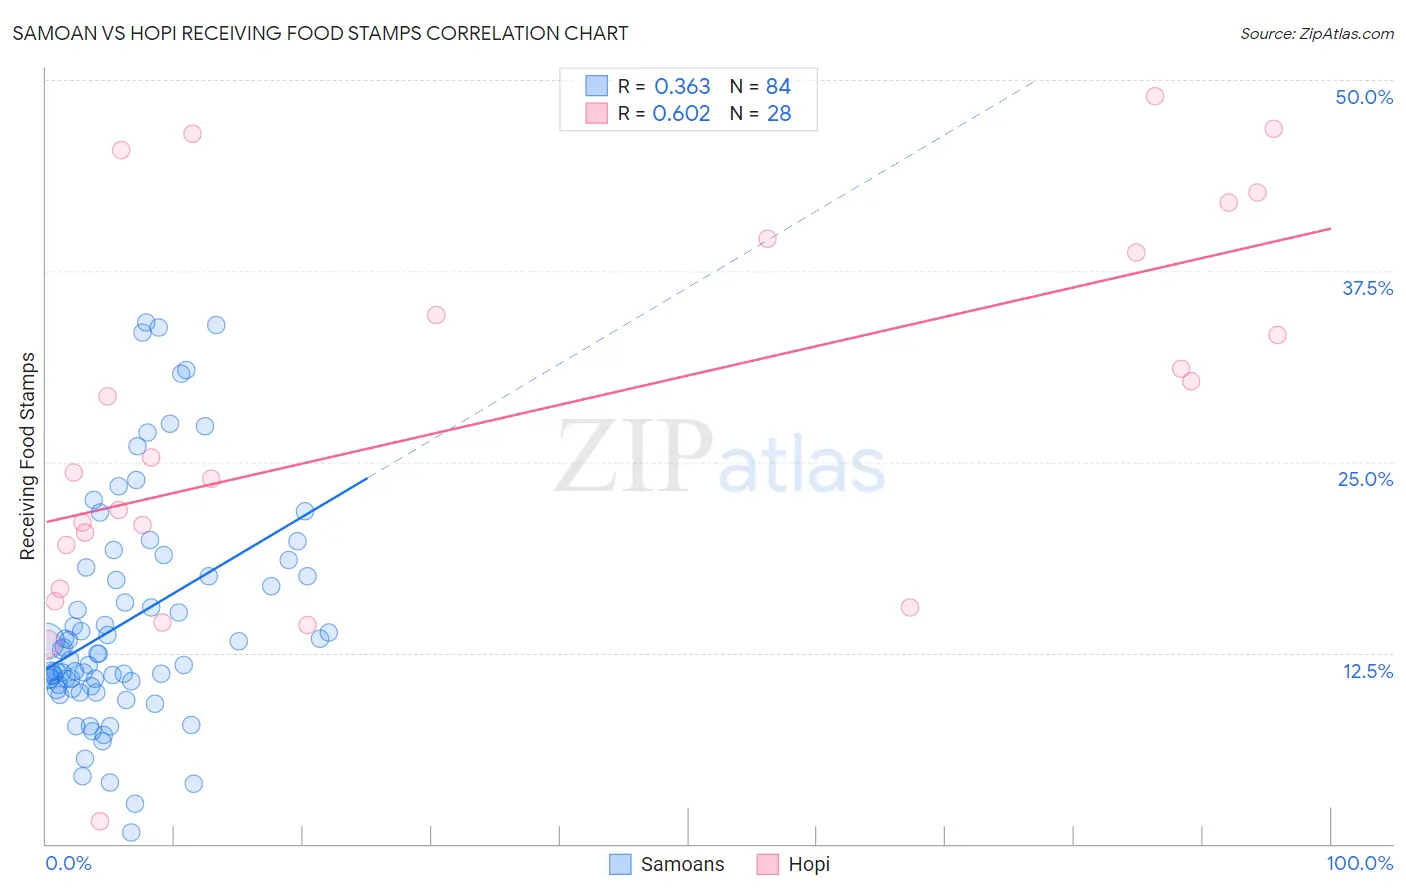
Samoan vs Hopi Receiving Food Stamps Correlation Chart
The statistical analysis conducted on geographies consisting of 224,983,999 people shows a mild positive correlation between the proportion of Samoans and percentage of population receiving government assistance and/or food stamps in the United States with a correlation coefficient (R) of 0.363 and weighted average of 12.1%. Similarly, the statistical analysis conducted on geographies consisting of 74,692,427 people shows a significant positive correlation between the proportion of Hopi and percentage of population receiving government assistance and/or food stamps in the United States with a correlation coefficient (R) of 0.602 and weighted average of 21.6%, a difference of 78.6%.
Receiving Food Stamps Correlation Summary
| Measurement | Samoan | Hopi |
| Minimum | 0.70% | 1.5% |
| Maximum | 34.1% | 48.9% |
| Range | 33.4% | 47.4% |
| Mean | 14.6% | 27.8% |
| Median | 12.4% | 24.8% |
| Interquartile 25% (IQ1) | 10.4% | 18.1% |
| Interquartile 75% (IQ3) | 17.8% | 39.1% |
| Interquartile Range (IQR) | 7.4% | 21.0% |
| Standard Deviation (Sample) | 7.5% | 12.5% |
| Standard Deviation (Population) | 7.5% | 12.3% |
Similar Demographics by Receiving Food Stamps
Demographics Similar to Samoans by Receiving Food Stamps
In terms of receiving food stamps, the demographic groups most similar to Samoans are Venezuelan (12.0%, a difference of 0.18%), Immigrants from Peru (12.0%, a difference of 0.19%), Immigrants from Cameroon (12.0%, a difference of 0.24%), Sudanese (12.0%, a difference of 0.38%), and Immigrants from Fiji (12.1%, a difference of 0.53%).
| Demographics | Rating | Rank | Receiving Food Stamps |
| Immigrants | Iraq | 37.1 /100 | #185 | Fair 12.0% |
| Spanish | 36.9 /100 | #186 | Fair 12.0% |
| Albanians | 35.4 /100 | #187 | Fair 12.0% |
| Sudanese | 33.4 /100 | #188 | Fair 12.0% |
| Immigrants | Cameroon | 32.5 /100 | #189 | Fair 12.0% |
| Immigrants | Peru | 32.2 /100 | #190 | Fair 12.0% |
| Venezuelans | 32.1 /100 | #191 | Fair 12.0% |
| Samoans | 31.0 /100 | #192 | Fair 12.1% |
| Immigrants | Fiji | 27.8 /100 | #193 | Fair 12.1% |
| Immigrants | Sudan | 27.1 /100 | #194 | Fair 12.1% |
| Americans | 26.7 /100 | #195 | Fair 12.2% |
| Iraqis | 26.6 /100 | #196 | Fair 12.2% |
| Delaware | 26.1 /100 | #197 | Fair 12.2% |
| Immigrants | Costa Rica | 25.4 /100 | #198 | Fair 12.2% |
| Portuguese | 25.1 /100 | #199 | Fair 12.2% |
Demographics Similar to Hopi by Receiving Food Stamps
In terms of receiving food stamps, the demographic groups most similar to Hopi are Tohono O'odham (21.5%, a difference of 0.37%), Immigrants from Yemen (21.6%, a difference of 0.41%), Yakama (21.4%, a difference of 0.63%), Dominican (21.4%, a difference of 0.89%), and Cape Verdean (21.1%, a difference of 2.3%).
| Demographics | Rating | Rank | Receiving Food Stamps |
| Inupiat | 0.0 /100 | #333 | Tragic 20.1% |
| Yuman | 0.0 /100 | #334 | Tragic 20.2% |
| Immigrants | Cuba | 0.0 /100 | #335 | Tragic 20.8% |
| Navajo | 0.0 /100 | #336 | Tragic 21.1% |
| Cape Verdeans | 0.0 /100 | #337 | Tragic 21.1% |
| Dominicans | 0.0 /100 | #338 | Tragic 21.4% |
| Yakama | 0.0 /100 | #339 | Tragic 21.4% |
| Tohono O'odham | 0.0 /100 | #340 | Tragic 21.5% |
| Hopi | 0.0 /100 | #341 | Tragic 21.6% |
| Immigrants | Yemen | 0.0 /100 | #342 | Tragic 21.6% |
| Immigrants | Dominican Republic | 0.0 /100 | #343 | Tragic 22.1% |
| Lumbee | 0.0 /100 | #344 | Tragic 22.9% |
| Immigrants | Cabo Verde | 0.0 /100 | #345 | Tragic 23.8% |
| Puerto Ricans | 0.0 /100 | #346 | Tragic 26.0% |
| Yup'ik | 0.0 /100 | #347 | Tragic 32.7% |