Samoan vs Immigrants from Dominica Receiving Food Stamps
COMPARE
Samoan
Immigrants from Dominica
Receiving Food Stamps
Receiving Food Stamps Comparison
Samoans
Immigrants from Dominica
12.1%
RECEIVING FOOD STAMPS
31.0/ 100
METRIC RATING
192nd/ 347
METRIC RANK
18.4%
RECEIVING FOOD STAMPS
0.0/ 100
METRIC RATING
329th/ 347
METRIC RANK
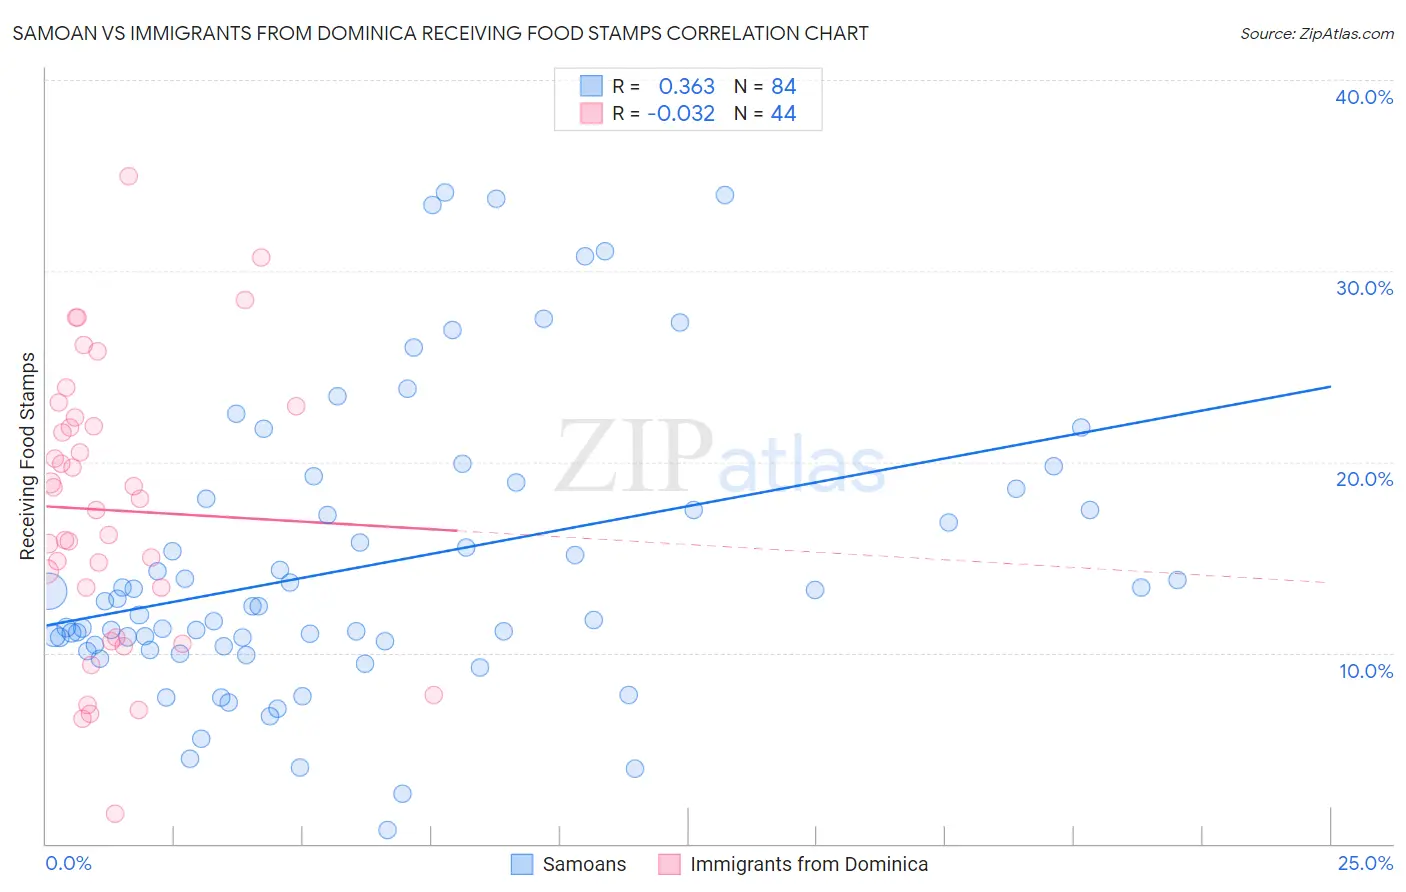
Samoan vs Immigrants from Dominica Receiving Food Stamps Correlation Chart
The statistical analysis conducted on geographies consisting of 224,983,999 people shows a mild positive correlation between the proportion of Samoans and percentage of population receiving government assistance and/or food stamps in the United States with a correlation coefficient (R) of 0.363 and weighted average of 12.1%. Similarly, the statistical analysis conducted on geographies consisting of 83,761,752 people shows no correlation between the proportion of Immigrants from Dominica and percentage of population receiving government assistance and/or food stamps in the United States with a correlation coefficient (R) of -0.032 and weighted average of 18.4%, a difference of 52.5%.
Receiving Food Stamps Correlation Summary
| Measurement | Samoan | Immigrants from Dominica |
| Minimum | 0.70% | 1.6% |
| Maximum | 34.1% | 35.0% |
| Range | 33.4% | 33.4% |
| Mean | 14.6% | 17.5% |
| Median | 12.4% | 17.8% |
| Interquartile 25% (IQ1) | 10.4% | 12.1% |
| Interquartile 75% (IQ3) | 17.8% | 22.1% |
| Interquartile Range (IQR) | 7.4% | 10.0% |
| Standard Deviation (Sample) | 7.5% | 7.3% |
| Standard Deviation (Population) | 7.5% | 7.2% |
Similar Demographics by Receiving Food Stamps
Demographics Similar to Samoans by Receiving Food Stamps
In terms of receiving food stamps, the demographic groups most similar to Samoans are Venezuelan (12.0%, a difference of 0.18%), Immigrants from Peru (12.0%, a difference of 0.19%), Immigrants from Cameroon (12.0%, a difference of 0.24%), Sudanese (12.0%, a difference of 0.38%), and Immigrants from Fiji (12.1%, a difference of 0.53%).
| Demographics | Rating | Rank | Receiving Food Stamps |
| Immigrants | Iraq | 37.1 /100 | #185 | Fair 12.0% |
| Spanish | 36.9 /100 | #186 | Fair 12.0% |
| Albanians | 35.4 /100 | #187 | Fair 12.0% |
| Sudanese | 33.4 /100 | #188 | Fair 12.0% |
| Immigrants | Cameroon | 32.5 /100 | #189 | Fair 12.0% |
| Immigrants | Peru | 32.2 /100 | #190 | Fair 12.0% |
| Venezuelans | 32.1 /100 | #191 | Fair 12.0% |
| Samoans | 31.0 /100 | #192 | Fair 12.1% |
| Immigrants | Fiji | 27.8 /100 | #193 | Fair 12.1% |
| Immigrants | Sudan | 27.1 /100 | #194 | Fair 12.1% |
| Americans | 26.7 /100 | #195 | Fair 12.2% |
| Iraqis | 26.6 /100 | #196 | Fair 12.2% |
| Delaware | 26.1 /100 | #197 | Fair 12.2% |
| Immigrants | Costa Rica | 25.4 /100 | #198 | Fair 12.2% |
| Portuguese | 25.1 /100 | #199 | Fair 12.2% |
Demographics Similar to Immigrants from Dominica by Receiving Food Stamps
In terms of receiving food stamps, the demographic groups most similar to Immigrants from Dominica are Colville (18.3%, a difference of 0.46%), Apache (18.3%, a difference of 0.67%), Cuban (18.2%, a difference of 0.98%), Immigrants from Haiti (18.2%, a difference of 1.1%), and British West Indian (17.9%, a difference of 2.9%).
| Demographics | Rating | Rank | Receiving Food Stamps |
| Immigrants | Grenada | 0.0 /100 | #322 | Tragic 17.8% |
| Haitians | 0.0 /100 | #323 | Tragic 17.8% |
| British West Indians | 0.0 /100 | #324 | Tragic 17.9% |
| Immigrants | Haiti | 0.0 /100 | #325 | Tragic 18.2% |
| Cubans | 0.0 /100 | #326 | Tragic 18.2% |
| Apache | 0.0 /100 | #327 | Tragic 18.3% |
| Colville | 0.0 /100 | #328 | Tragic 18.3% |
| Immigrants | Dominica | 0.0 /100 | #329 | Tragic 18.4% |
| Pima | 0.0 /100 | #330 | Tragic 19.0% |
| Immigrants | Caribbean | 0.0 /100 | #331 | Tragic 19.6% |
| Pueblo | 0.0 /100 | #332 | Tragic 19.9% |
| Inupiat | 0.0 /100 | #333 | Tragic 20.1% |
| Yuman | 0.0 /100 | #334 | Tragic 20.2% |
| Immigrants | Cuba | 0.0 /100 | #335 | Tragic 20.8% |
| Navajo | 0.0 /100 | #336 | Tragic 21.1% |