Pima vs Carpatho Rusyn Receiving Food Stamps
COMPARE
Pima
Carpatho Rusyn
Receiving Food Stamps
Receiving Food Stamps Comparison
Pima
Carpatho Rusyns
19.0%
RECEIVING FOOD STAMPS
0.0/ 100
METRIC RATING
330th/ 347
METRIC RANK
10.4%
RECEIVING FOOD STAMPS
96.2/ 100
METRIC RATING
108th/ 347
METRIC RANK
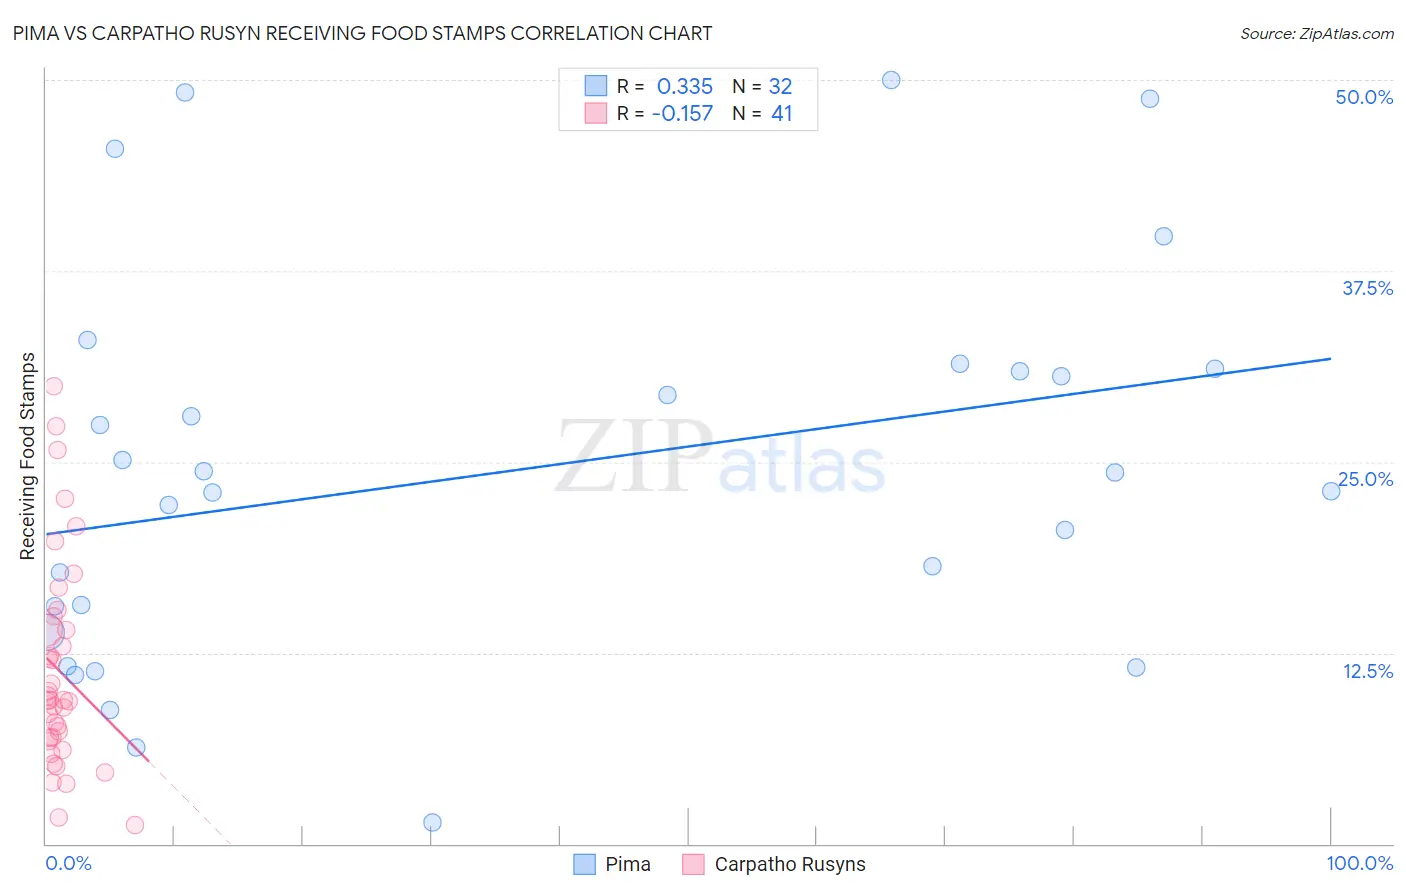
Pima vs Carpatho Rusyn Receiving Food Stamps Correlation Chart
The statistical analysis conducted on geographies consisting of 61,500,304 people shows a mild positive correlation between the proportion of Pima and percentage of population receiving government assistance and/or food stamps in the United States with a correlation coefficient (R) of 0.335 and weighted average of 19.0%. Similarly, the statistical analysis conducted on geographies consisting of 58,758,722 people shows a poor negative correlation between the proportion of Carpatho Rusyns and percentage of population receiving government assistance and/or food stamps in the United States with a correlation coefficient (R) of -0.157 and weighted average of 10.4%, a difference of 82.2%.
Receiving Food Stamps Correlation Summary
| Measurement | Pima | Carpatho Rusyn |
| Minimum | 1.4% | 1.2% |
| Maximum | 50.0% | 29.9% |
| Range | 48.6% | 28.7% |
| Mean | 24.4% | 11.3% |
| Median | 23.7% | 9.4% |
| Interquartile 25% (IQ1) | 14.7% | 6.8% |
| Interquartile 75% (IQ3) | 31.0% | 14.4% |
| Interquartile Range (IQR) | 16.3% | 7.6% |
| Standard Deviation (Sample) | 12.7% | 6.8% |
| Standard Deviation (Population) | 12.5% | 6.7% |
Similar Demographics by Receiving Food Stamps
Demographics Similar to Pima by Receiving Food Stamps
In terms of receiving food stamps, the demographic groups most similar to Pima are Immigrants from Dominica (18.4%, a difference of 3.0%), Immigrants from Caribbean (19.6%, a difference of 3.4%), Colville (18.3%, a difference of 3.5%), Apache (18.3%, a difference of 3.7%), and Cuban (18.2%, a difference of 4.1%).
| Demographics | Rating | Rank | Receiving Food Stamps |
| Haitians | 0.0 /100 | #323 | Tragic 17.8% |
| British West Indians | 0.0 /100 | #324 | Tragic 17.9% |
| Immigrants | Haiti | 0.0 /100 | #325 | Tragic 18.2% |
| Cubans | 0.0 /100 | #326 | Tragic 18.2% |
| Apache | 0.0 /100 | #327 | Tragic 18.3% |
| Colville | 0.0 /100 | #328 | Tragic 18.3% |
| Immigrants | Dominica | 0.0 /100 | #329 | Tragic 18.4% |
| Pima | 0.0 /100 | #330 | Tragic 19.0% |
| Immigrants | Caribbean | 0.0 /100 | #331 | Tragic 19.6% |
| Pueblo | 0.0 /100 | #332 | Tragic 19.9% |
| Inupiat | 0.0 /100 | #333 | Tragic 20.1% |
| Yuman | 0.0 /100 | #334 | Tragic 20.2% |
| Immigrants | Cuba | 0.0 /100 | #335 | Tragic 20.8% |
| Navajo | 0.0 /100 | #336 | Tragic 21.1% |
| Cape Verdeans | 0.0 /100 | #337 | Tragic 21.1% |
Demographics Similar to Carpatho Rusyns by Receiving Food Stamps
In terms of receiving food stamps, the demographic groups most similar to Carpatho Rusyns are Korean (10.4%, a difference of 0.030%), Immigrants from Pakistan (10.4%, a difference of 0.040%), Immigrants from Italy (10.4%, a difference of 0.19%), Immigrants from Malaysia (10.4%, a difference of 0.27%), and Pakistani (10.4%, a difference of 0.33%).
| Demographics | Rating | Rank | Receiving Food Stamps |
| Palestinians | 96.9 /100 | #101 | Exceptional 10.3% |
| Immigrants | Europe | 96.8 /100 | #102 | Exceptional 10.3% |
| Immigrants | Latvia | 96.8 /100 | #103 | Exceptional 10.3% |
| Immigrants | Hungary | 96.7 /100 | #104 | Exceptional 10.3% |
| Immigrants | Malaysia | 96.5 /100 | #105 | Exceptional 10.4% |
| Immigrants | Italy | 96.4 /100 | #106 | Exceptional 10.4% |
| Koreans | 96.3 /100 | #107 | Exceptional 10.4% |
| Carpatho Rusyns | 96.2 /100 | #108 | Exceptional 10.4% |
| Immigrants | Pakistan | 96.2 /100 | #109 | Exceptional 10.4% |
| Pakistanis | 95.9 /100 | #110 | Exceptional 10.4% |
| Romanians | 95.8 /100 | #111 | Exceptional 10.4% |
| Mongolians | 95.8 /100 | #112 | Exceptional 10.5% |
| Icelanders | 95.4 /100 | #113 | Exceptional 10.5% |
| Scotch-Irish | 95.1 /100 | #114 | Exceptional 10.5% |
| Immigrants | Saudi Arabia | 94.9 /100 | #115 | Exceptional 10.5% |