Salvadoran vs Immigrants from Korea Disability Age 18 to 34
COMPARE
Salvadoran
Immigrants from Korea
Disability Age 18 to 34
Disability Age 18 to 34 Comparison
Salvadorans
Immigrants from Korea
6.0%
DISABILITY AGE 18 TO 34
99.6/ 100
METRIC RATING
63rd/ 347
METRIC RANK
5.9%
DISABILITY AGE 18 TO 34
99.8/ 100
METRIC RATING
46th/ 347
METRIC RANK
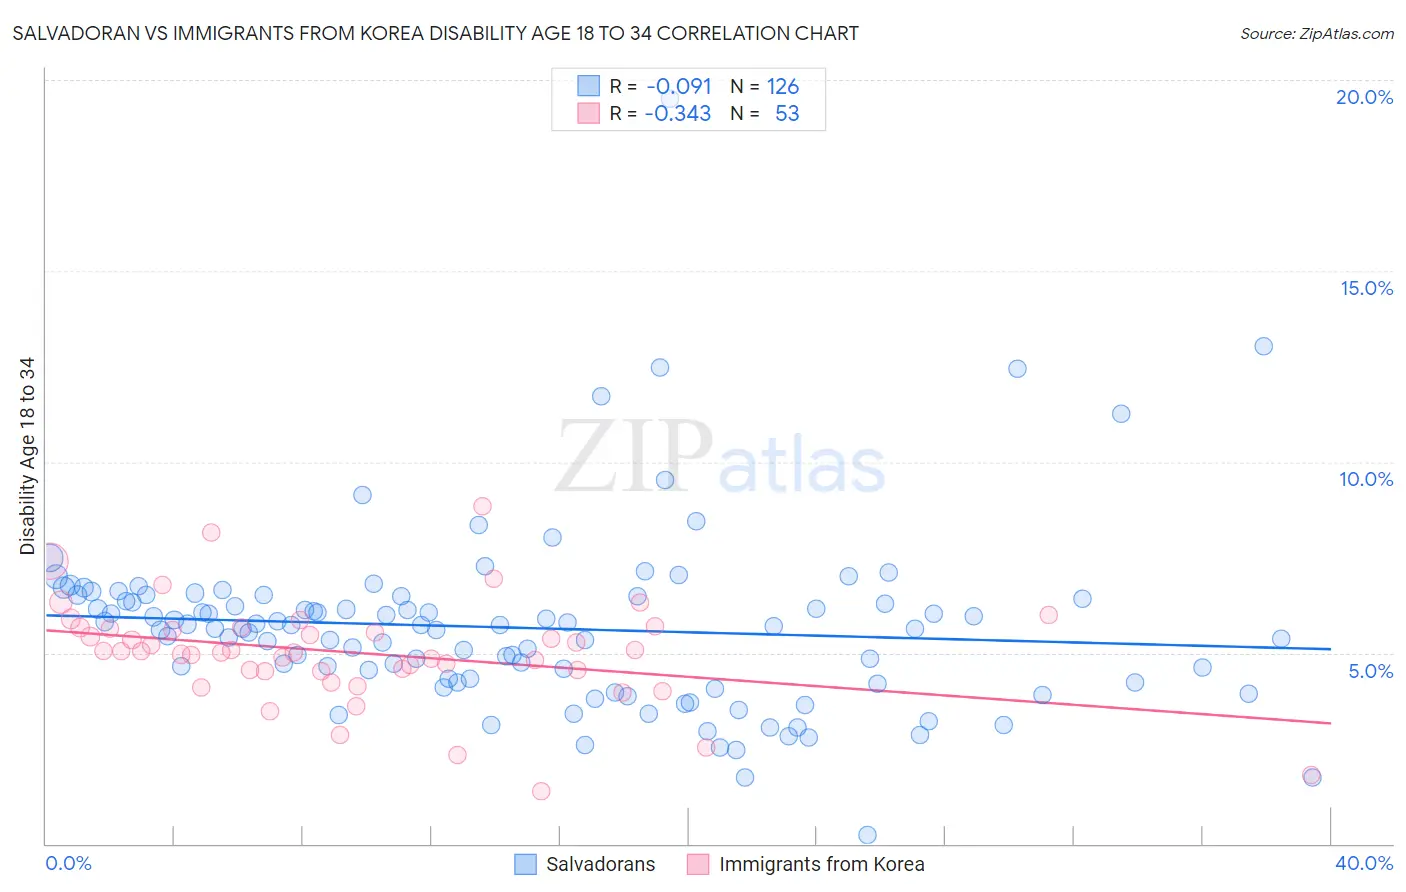
Salvadoran vs Immigrants from Korea Disability Age 18 to 34 Correlation Chart
The statistical analysis conducted on geographies consisting of 398,205,845 people shows a slight negative correlation between the proportion of Salvadorans and percentage of population with a disability between the ages 18 and 35 in the United States with a correlation coefficient (R) of -0.091 and weighted average of 6.0%. Similarly, the statistical analysis conducted on geographies consisting of 415,424,046 people shows a mild negative correlation between the proportion of Immigrants from Korea and percentage of population with a disability between the ages 18 and 35 in the United States with a correlation coefficient (R) of -0.343 and weighted average of 5.9%, a difference of 1.7%.
Disability Age 18 to 34 Correlation Summary
| Measurement | Salvadoran | Immigrants from Korea |
| Minimum | 0.22% | 1.4% |
| Maximum | 19.5% | 8.8% |
| Range | 19.3% | 7.5% |
| Mean | 5.7% | 5.0% |
| Median | 5.7% | 5.0% |
| Interquartile 25% (IQ1) | 4.2% | 4.5% |
| Interquartile 75% (IQ3) | 6.5% | 5.6% |
| Interquartile Range (IQR) | 2.2% | 1.1% |
| Standard Deviation (Sample) | 2.4% | 1.4% |
| Standard Deviation (Population) | 2.4% | 1.4% |
Demographics Similar to Salvadorans and Immigrants from Korea by Disability Age 18 to 34
In terms of disability age 18 to 34, the demographic groups most similar to Salvadorans are Taiwanese (6.0%, a difference of 0.010%), Peruvian (6.0%, a difference of 0.050%), British West Indian (6.0%, a difference of 0.080%), Immigrants from Caribbean (6.0%, a difference of 0.34%), and Immigrants from Sri Lanka (6.0%, a difference of 0.34%). Similarly, the demographic groups most similar to Immigrants from Korea are Immigrants from Egypt (5.9%, a difference of 0.050%), Immigrants from Peru (5.9%, a difference of 0.13%), Immigrants from Asia (5.9%, a difference of 0.26%), Immigrants from Trinidad and Tobago (5.9%, a difference of 0.47%), and Immigrants from Belarus (5.9%, a difference of 0.57%).
| Demographics | Rating | Rank | Disability Age 18 to 34 |
| Immigrants | Asia | 99.8 /100 | #44 | Exceptional 5.9% |
| Immigrants | Peru | 99.8 /100 | #45 | Exceptional 5.9% |
| Immigrants | Korea | 99.8 /100 | #46 | Exceptional 5.9% |
| Immigrants | Egypt | 99.8 /100 | #47 | Exceptional 5.9% |
| Immigrants | Trinidad and Tobago | 99.8 /100 | #48 | Exceptional 5.9% |
| Immigrants | Belarus | 99.8 /100 | #49 | Exceptional 5.9% |
| Immigrants | El Salvador | 99.8 /100 | #50 | Exceptional 5.9% |
| Egyptians | 99.8 /100 | #51 | Exceptional 5.9% |
| Okinawans | 99.7 /100 | #52 | Exceptional 5.9% |
| Immigrants | Indonesia | 99.7 /100 | #53 | Exceptional 5.9% |
| Immigrants | Malaysia | 99.7 /100 | #54 | Exceptional 5.9% |
| Immigrants | Spain | 99.7 /100 | #55 | Exceptional 5.9% |
| Paraguayans | 99.7 /100 | #56 | Exceptional 5.9% |
| Immigrants | Haiti | 99.7 /100 | #57 | Exceptional 5.9% |
| Immigrants | Serbia | 99.7 /100 | #58 | Exceptional 5.9% |
| Immigrants | Caribbean | 99.6 /100 | #59 | Exceptional 6.0% |
| Immigrants | Sri Lanka | 99.6 /100 | #60 | Exceptional 6.0% |
| British West Indians | 99.6 /100 | #61 | Exceptional 6.0% |
| Peruvians | 99.6 /100 | #62 | Exceptional 6.0% |
| Salvadorans | 99.6 /100 | #63 | Exceptional 6.0% |
| Taiwanese | 99.6 /100 | #64 | Exceptional 6.0% |