Puget Sound Salish vs Immigrants from Denmark Female Poverty
COMPARE
Puget Sound Salish
Immigrants from Denmark
Female Poverty
Female Poverty Comparison
Puget Sound Salish
Immigrants from Denmark
12.7%
FEMALE POVERTY
91.5/ 100
METRIC RATING
115th/ 347
METRIC RANK
12.4%
FEMALE POVERTY
95.8/ 100
METRIC RATING
90th/ 347
METRIC RANK
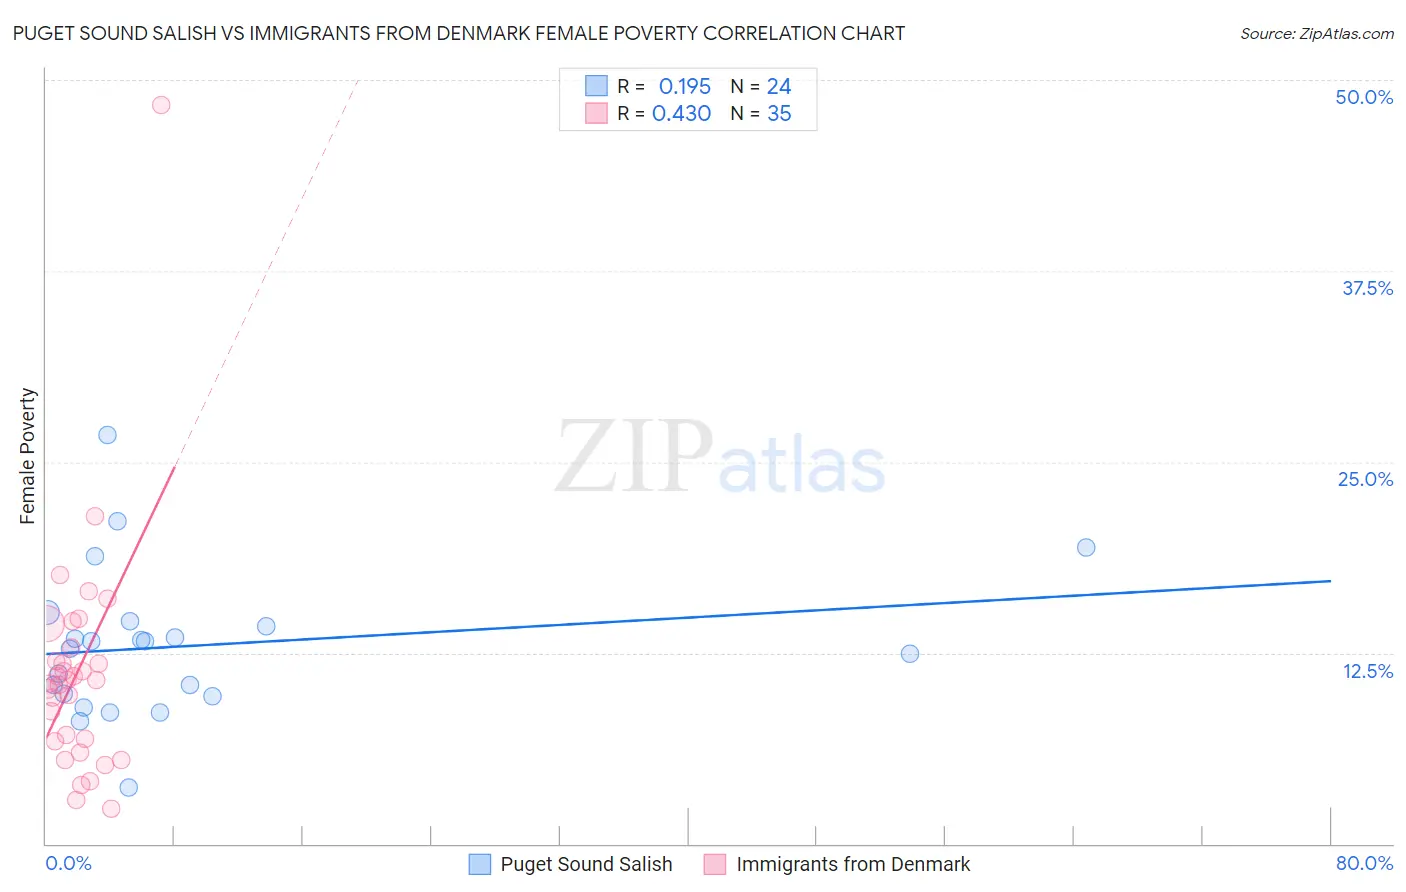
Puget Sound Salish vs Immigrants from Denmark Female Poverty Correlation Chart
The statistical analysis conducted on geographies consisting of 46,146,424 people shows a poor positive correlation between the proportion of Puget Sound Salish and poverty level among females in the United States with a correlation coefficient (R) of 0.195 and weighted average of 12.7%. Similarly, the statistical analysis conducted on geographies consisting of 136,395,375 people shows a moderate positive correlation between the proportion of Immigrants from Denmark and poverty level among females in the United States with a correlation coefficient (R) of 0.430 and weighted average of 12.4%, a difference of 1.9%.
Female Poverty Correlation Summary
| Measurement | Puget Sound Salish | Immigrants from Denmark |
| Minimum | 3.6% | 2.3% |
| Maximum | 26.7% | 48.4% |
| Range | 23.1% | 46.1% |
| Mean | 13.0% | 11.2% |
| Median | 13.0% | 10.7% |
| Interquartile 25% (IQ1) | 9.8% | 6.7% |
| Interquartile 75% (IQ3) | 14.4% | 12.9% |
| Interquartile Range (IQR) | 4.7% | 6.1% |
| Standard Deviation (Sample) | 4.9% | 7.8% |
| Standard Deviation (Population) | 4.8% | 7.7% |
Similar Demographics by Female Poverty
Demographics Similar to Puget Sound Salish by Female Poverty
In terms of female poverty, the demographic groups most similar to Puget Sound Salish are Welsh (12.7%, a difference of 0.020%), Immigrants from Russia (12.7%, a difference of 0.12%), Canadian (12.7%, a difference of 0.14%), Immigrants from Israel (12.6%, a difference of 0.17%), and Immigrants from Southern Europe (12.7%, a difference of 0.20%).
| Demographics | Rating | Rank | Female Poverty |
| Portuguese | 93.1 /100 | #108 | Exceptional 12.6% |
| Immigrants | Zimbabwe | 93.1 /100 | #109 | Exceptional 12.6% |
| Paraguayans | 93.0 /100 | #110 | Exceptional 12.6% |
| Soviet Union | 92.4 /100 | #111 | Exceptional 12.6% |
| Immigrants | Israel | 92.0 /100 | #112 | Exceptional 12.6% |
| Canadians | 92.0 /100 | #113 | Exceptional 12.7% |
| Welsh | 91.6 /100 | #114 | Exceptional 12.7% |
| Puget Sound Salish | 91.5 /100 | #115 | Exceptional 12.7% |
| Immigrants | Russia | 91.2 /100 | #116 | Exceptional 12.7% |
| Immigrants | Southern Europe | 90.9 /100 | #117 | Exceptional 12.7% |
| Sri Lankans | 90.9 /100 | #118 | Exceptional 12.7% |
| Albanians | 90.8 /100 | #119 | Exceptional 12.7% |
| New Zealanders | 90.6 /100 | #120 | Exceptional 12.7% |
| Immigrants | Hungary | 90.3 /100 | #121 | Exceptional 12.7% |
| French Canadians | 90.2 /100 | #122 | Exceptional 12.7% |
Demographics Similar to Immigrants from Denmark by Female Poverty
In terms of female poverty, the demographic groups most similar to Immigrants from Denmark are Belgian (12.4%, a difference of 0.010%), Czechoslovakian (12.4%, a difference of 0.020%), Immigrants from Egypt (12.5%, a difference of 0.20%), English (12.4%, a difference of 0.22%), and Immigrants from Indonesia (12.5%, a difference of 0.22%).
| Demographics | Rating | Rank | Female Poverty |
| Immigrants | England | 96.9 /100 | #83 | Exceptional 12.3% |
| Northern Europeans | 96.6 /100 | #84 | Exceptional 12.4% |
| Irish | 96.5 /100 | #85 | Exceptional 12.4% |
| Dutch | 96.5 /100 | #86 | Exceptional 12.4% |
| Okinawans | 96.4 /100 | #87 | Exceptional 12.4% |
| Finns | 96.4 /100 | #88 | Exceptional 12.4% |
| English | 96.1 /100 | #89 | Exceptional 12.4% |
| Immigrants | Denmark | 95.8 /100 | #90 | Exceptional 12.4% |
| Belgians | 95.8 /100 | #91 | Exceptional 12.4% |
| Czechoslovakians | 95.7 /100 | #92 | Exceptional 12.4% |
| Immigrants | Egypt | 95.5 /100 | #93 | Exceptional 12.5% |
| Immigrants | Indonesia | 95.4 /100 | #94 | Exceptional 12.5% |
| Immigrants | South Africa | 95.4 /100 | #95 | Exceptional 12.5% |
| British | 95.2 /100 | #96 | Exceptional 12.5% |
| Australians | 95.2 /100 | #97 | Exceptional 12.5% |