Immigrants from Lebanon vs Tsimshian Single Mother Poverty
COMPARE
Immigrants from Lebanon
Tsimshian
Single Mother Poverty
Single Mother Poverty Comparison
Immigrants from Lebanon
Tsimshian
28.6%
SINGLE MOTHER POVERTY
85.3/ 100
METRIC RATING
147th/ 347
METRIC RANK
26.8%
SINGLE MOTHER POVERTY
99.9/ 100
METRIC RATING
43rd/ 347
METRIC RANK
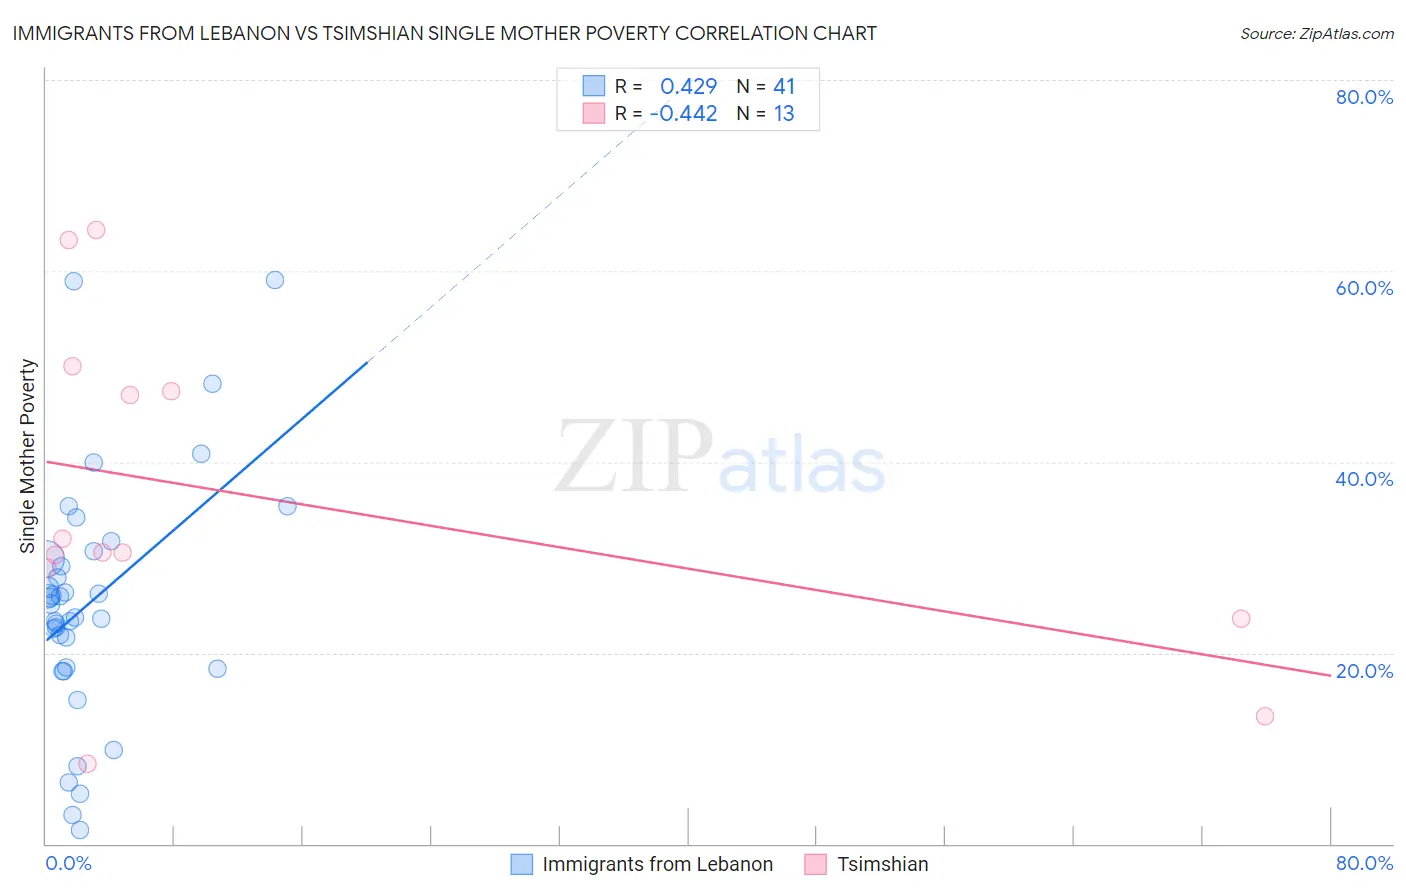
Immigrants from Lebanon vs Tsimshian Single Mother Poverty Correlation Chart
The statistical analysis conducted on geographies consisting of 213,301,083 people shows a moderate positive correlation between the proportion of Immigrants from Lebanon and poverty level among single mothers in the United States with a correlation coefficient (R) of 0.429 and weighted average of 28.6%. Similarly, the statistical analysis conducted on geographies consisting of 15,606,004 people shows a moderate negative correlation between the proportion of Tsimshian and poverty level among single mothers in the United States with a correlation coefficient (R) of -0.442 and weighted average of 26.8%, a difference of 6.4%.
Single Mother Poverty Correlation Summary
| Measurement | Immigrants from Lebanon | Tsimshian |
| Minimum | 1.4% | 8.3% |
| Maximum | 59.0% | 64.3% |
| Range | 57.6% | 56.0% |
| Mean | 25.3% | 36.1% |
| Median | 25.1% | 30.6% |
| Interquartile 25% (IQ1) | 18.4% | 26.2% |
| Interquartile 75% (IQ3) | 30.2% | 48.7% |
| Interquartile Range (IQR) | 11.8% | 22.5% |
| Standard Deviation (Sample) | 12.6% | 17.3% |
| Standard Deviation (Population) | 12.5% | 16.6% |
Similar Demographics by Single Mother Poverty
Demographics Similar to Immigrants from Lebanon by Single Mother Poverty
In terms of single mother poverty, the demographic groups most similar to Immigrants from Lebanon are Syrian (28.6%, a difference of 0.010%), Serbian (28.6%, a difference of 0.030%), Immigrants from Denmark (28.5%, a difference of 0.070%), Immigrants from South America (28.5%, a difference of 0.080%), and Luxembourger (28.5%, a difference of 0.11%).
| Demographics | Rating | Rank | Single Mother Poverty |
| Immigrants | Colombia | 88.0 /100 | #140 | Excellent 28.5% |
| Danes | 87.1 /100 | #141 | Excellent 28.5% |
| South Africans | 86.6 /100 | #142 | Excellent 28.5% |
| Immigrants | North America | 86.5 /100 | #143 | Excellent 28.5% |
| Luxembourgers | 86.4 /100 | #144 | Excellent 28.5% |
| Immigrants | South America | 86.1 /100 | #145 | Excellent 28.5% |
| Immigrants | Denmark | 86.1 /100 | #146 | Excellent 28.5% |
| Immigrants | Lebanon | 85.3 /100 | #147 | Excellent 28.6% |
| Syrians | 85.3 /100 | #148 | Excellent 28.6% |
| Serbians | 85.0 /100 | #149 | Excellent 28.6% |
| Northern Europeans | 81.7 /100 | #150 | Excellent 28.6% |
| Immigrants | Oceania | 79.9 /100 | #151 | Good 28.7% |
| Austrians | 79.0 /100 | #152 | Good 28.7% |
| Slovenes | 76.4 /100 | #153 | Good 28.8% |
| Portuguese | 73.2 /100 | #154 | Good 28.8% |
Demographics Similar to Tsimshian by Single Mother Poverty
In terms of single mother poverty, the demographic groups most similar to Tsimshian are Armenian (26.8%, a difference of 0.080%), Immigrants from Sierra Leone (26.9%, a difference of 0.14%), Latvian (26.9%, a difference of 0.21%), Immigrants from Serbia (26.9%, a difference of 0.26%), and Immigrants from Greece (26.7%, a difference of 0.31%).
| Demographics | Rating | Rank | Single Mother Poverty |
| Okinawans | 99.9 /100 | #36 | Exceptional 26.6% |
| Immigrants | Israel | 99.9 /100 | #37 | Exceptional 26.6% |
| Immigrants | Fiji | 99.9 /100 | #38 | Exceptional 26.6% |
| Sri Lankans | 99.9 /100 | #39 | Exceptional 26.7% |
| Immigrants | Vietnam | 99.9 /100 | #40 | Exceptional 26.7% |
| Immigrants | Greece | 99.9 /100 | #41 | Exceptional 26.7% |
| Armenians | 99.9 /100 | #42 | Exceptional 26.8% |
| Tsimshian | 99.9 /100 | #43 | Exceptional 26.8% |
| Immigrants | Sierra Leone | 99.9 /100 | #44 | Exceptional 26.9% |
| Latvians | 99.9 /100 | #45 | Exceptional 26.9% |
| Immigrants | Serbia | 99.9 /100 | #46 | Exceptional 26.9% |
| Egyptians | 99.8 /100 | #47 | Exceptional 26.9% |
| Immigrants | Poland | 99.8 /100 | #48 | Exceptional 26.9% |
| Cambodians | 99.8 /100 | #49 | Exceptional 27.0% |
| Laotians | 99.8 /100 | #50 | Exceptional 27.0% |