Puerto Rican vs Tsimshian Median Household Income
COMPARE
Puerto Rican
Tsimshian
Median Household Income
Median Household Income Comparison
Puerto Ricans
Tsimshian
$59,197
MEDIAN HOUSEHOLD INCOME
0.0/ 100
METRIC RATING
345th/ 347
METRIC RANK
$83,346
MEDIAN HOUSEHOLD INCOME
24.5/ 100
METRIC RATING
200th/ 347
METRIC RANK
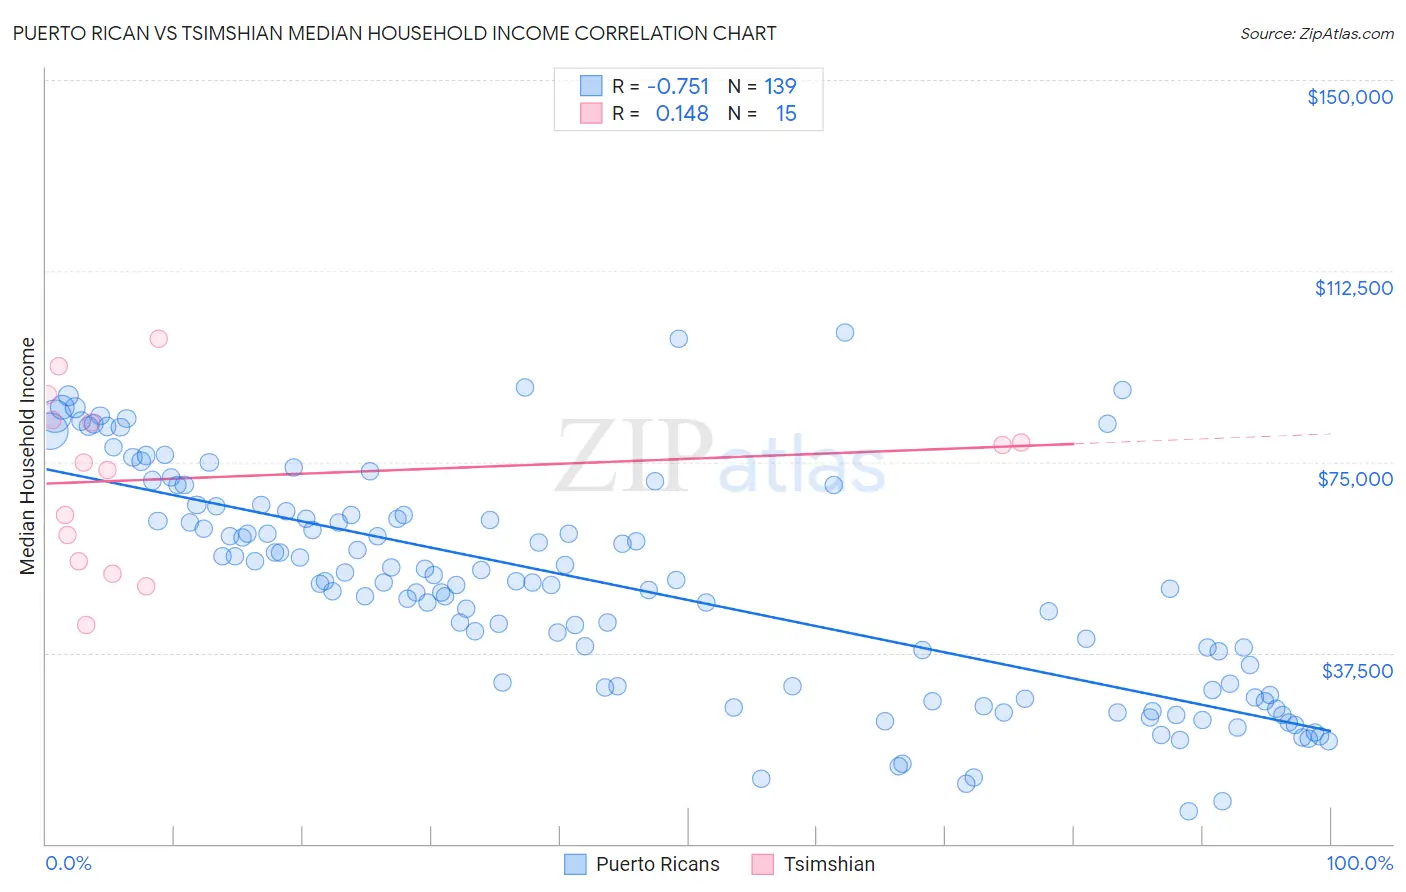
Puerto Rican vs Tsimshian Median Household Income Correlation Chart
The statistical analysis conducted on geographies consisting of 527,459,436 people shows a strong negative correlation between the proportion of Puerto Ricans and median household income in the United States with a correlation coefficient (R) of -0.751 and weighted average of $59,197. Similarly, the statistical analysis conducted on geographies consisting of 15,626,462 people shows a poor positive correlation between the proportion of Tsimshian and median household income in the United States with a correlation coefficient (R) of 0.148 and weighted average of $83,346, a difference of 40.8%.
Median Household Income Correlation Summary
| Measurement | Puerto Rican | Tsimshian |
| Minimum | $6,449 | $42,857 |
| Maximum | $100,425 | $99,167 |
| Range | $93,976 | $56,310 |
| Mean | $50,898 | $71,994 |
| Median | $51,527 | $75,000 |
| Interquartile 25% (IQ1) | $30,679 | $55,448 |
| Interquartile 75% (IQ3) | $65,376 | $83,217 |
| Interquartile Range (IQR) | $34,697 | $27,769 |
| Standard Deviation (Sample) | $21,767 | $16,777 |
| Standard Deviation (Population) | $21,689 | $16,208 |
Similar Demographics by Median Household Income
Demographics Similar to Puerto Ricans by Median Household Income
In terms of median household income, the demographic groups most similar to Puerto Ricans are Navajo ($59,159, a difference of 0.060%), Tohono O'odham ($61,663, a difference of 4.2%), Houma ($62,575, a difference of 5.7%), Pima ($63,262, a difference of 6.9%), and Crow ($63,681, a difference of 7.6%).
| Demographics | Rating | Rank | Median Household Income |
| Creek | 0.0 /100 | #333 | Tragic $67,715 |
| Blacks/African Americans | 0.0 /100 | #334 | Tragic $67,573 |
| Cheyenne | 0.0 /100 | #335 | Tragic $66,974 |
| Immigrants | Congo | 0.0 /100 | #336 | Tragic $66,768 |
| Kiowa | 0.0 /100 | #337 | Tragic $65,914 |
| Immigrants | Yemen | 0.0 /100 | #338 | Tragic $65,194 |
| Hopi | 0.0 /100 | #339 | Tragic $65,043 |
| Pueblo | 0.0 /100 | #340 | Tragic $64,692 |
| Crow | 0.0 /100 | #341 | Tragic $63,681 |
| Pima | 0.0 /100 | #342 | Tragic $63,262 |
| Houma | 0.0 /100 | #343 | Tragic $62,575 |
| Tohono O'odham | 0.0 /100 | #344 | Tragic $61,663 |
| Puerto Ricans | 0.0 /100 | #345 | Tragic $59,197 |
| Navajo | 0.0 /100 | #346 | Tragic $59,159 |
| Lumbee | 0.0 /100 | #347 | Tragic $54,644 |
Demographics Similar to Tsimshian by Median Household Income
In terms of median household income, the demographic groups most similar to Tsimshian are Spanish ($83,343, a difference of 0.0%), German ($83,358, a difference of 0.010%), Immigrants from Thailand ($83,327, a difference of 0.020%), Immigrants from Cambodia ($83,304, a difference of 0.050%), and Japanese ($83,395, a difference of 0.060%).
| Demographics | Rating | Rank | Median Household Income |
| Finns | 27.7 /100 | #193 | Fair $83,607 |
| Ghanaians | 27.4 /100 | #194 | Fair $83,582 |
| Immigrants | Armenia | 27.0 /100 | #195 | Fair $83,555 |
| French | 26.0 /100 | #196 | Fair $83,468 |
| Aleuts | 25.7 /100 | #197 | Fair $83,446 |
| Japanese | 25.1 /100 | #198 | Fair $83,395 |
| Germans | 24.6 /100 | #199 | Fair $83,358 |
| Tsimshian | 24.5 /100 | #200 | Fair $83,346 |
| Spanish | 24.4 /100 | #201 | Fair $83,343 |
| Immigrants | Thailand | 24.3 /100 | #202 | Fair $83,327 |
| Immigrants | Cambodia | 24.0 /100 | #203 | Fair $83,304 |
| Immigrants | Africa | 23.8 /100 | #204 | Fair $83,289 |
| Celtics | 22.7 /100 | #205 | Fair $83,193 |
| Immigrants | Kenya | 21.3 /100 | #206 | Fair $83,068 |
| Dutch | 20.3 /100 | #207 | Fair $82,971 |