Puerto Rican vs Honduran Per Capita Income
COMPARE
Puerto Rican
Honduran
Per Capita Income
Per Capita Income Comparison
Puerto Ricans
Hondurans
$31,268
PER CAPITA INCOME
0.0/ 100
METRIC RATING
341st/ 347
METRIC RANK
$37,031
PER CAPITA INCOME
0.1/ 100
METRIC RATING
304th/ 347
METRIC RANK
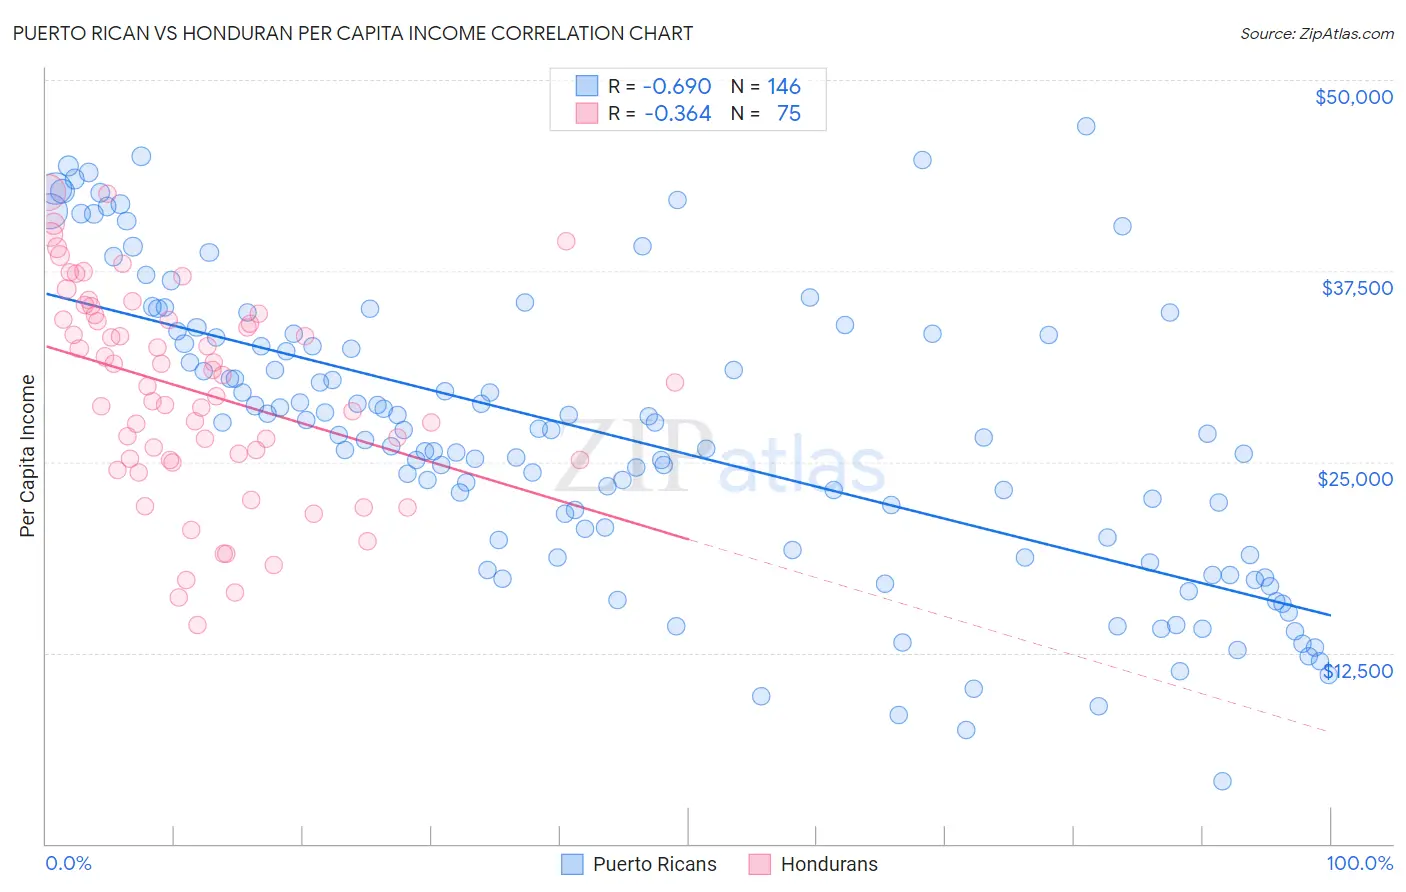
Puerto Rican vs Honduran Per Capita Income Correlation Chart
The statistical analysis conducted on geographies consisting of 528,362,553 people shows a significant negative correlation between the proportion of Puerto Ricans and per capita income in the United States with a correlation coefficient (R) of -0.690 and weighted average of $31,268. Similarly, the statistical analysis conducted on geographies consisting of 357,835,074 people shows a mild negative correlation between the proportion of Hondurans and per capita income in the United States with a correlation coefficient (R) of -0.364 and weighted average of $37,031, a difference of 18.4%.
Per Capita Income Correlation Summary
| Measurement | Puerto Rican | Honduran |
| Minimum | $4,085 | $14,358 |
| Maximum | $46,990 | $42,674 |
| Range | $42,905 | $28,316 |
| Mean | $26,618 | $29,671 |
| Median | $26,784 | $30,191 |
| Interquartile 25% (IQ1) | $18,902 | $25,099 |
| Interquartile 75% (IQ3) | $33,347 | $34,632 |
| Interquartile Range (IQR) | $14,444 | $9,533 |
| Standard Deviation (Sample) | $9,544 | $6,736 |
| Standard Deviation (Population) | $9,511 | $6,690 |
Similar Demographics by Per Capita Income
Demographics Similar to Puerto Ricans by Per Capita Income
In terms of per capita income, the demographic groups most similar to Puerto Ricans are Hopi ($31,177, a difference of 0.29%), Crow ($31,729, a difference of 1.5%), Pima ($30,644, a difference of 2.0%), Pueblo ($32,012, a difference of 2.4%), and Yup'ik ($30,518, a difference of 2.5%).
| Demographics | Rating | Rank | Per Capita Income |
| Immigrants | Yemen | 0.0 /100 | #333 | Tragic $33,696 |
| Natives/Alaskans | 0.0 /100 | #334 | Tragic $33,279 |
| Yuman | 0.0 /100 | #335 | Tragic $33,236 |
| Yakama | 0.0 /100 | #336 | Tragic $33,009 |
| Houma | 0.0 /100 | #337 | Tragic $32,996 |
| Arapaho | 0.0 /100 | #338 | Tragic $32,345 |
| Pueblo | 0.0 /100 | #339 | Tragic $32,012 |
| Crow | 0.0 /100 | #340 | Tragic $31,729 |
| Puerto Ricans | 0.0 /100 | #341 | Tragic $31,268 |
| Hopi | 0.0 /100 | #342 | Tragic $31,177 |
| Pima | 0.0 /100 | #343 | Tragic $30,644 |
| Yup'ik | 0.0 /100 | #344 | Tragic $30,518 |
| Tohono O'odham | 0.0 /100 | #345 | Tragic $30,256 |
| Lumbee | 0.0 /100 | #346 | Tragic $29,845 |
| Navajo | 0.0 /100 | #347 | Tragic $29,031 |
Demographics Similar to Hondurans by Per Capita Income
In terms of per capita income, the demographic groups most similar to Hondurans are Inupiat ($36,999, a difference of 0.080%), Paiute ($37,066, a difference of 0.090%), Shoshone ($37,072, a difference of 0.11%), Ottawa ($37,101, a difference of 0.19%), and Immigrants from Bahamas ($37,193, a difference of 0.44%).
| Demographics | Rating | Rank | Per Capita Income |
| Haitians | 0.1 /100 | #297 | Tragic $37,289 |
| Immigrants | Caribbean | 0.1 /100 | #298 | Tragic $37,254 |
| Cherokee | 0.1 /100 | #299 | Tragic $37,203 |
| Immigrants | Bahamas | 0.1 /100 | #300 | Tragic $37,193 |
| Ottawa | 0.1 /100 | #301 | Tragic $37,101 |
| Shoshone | 0.1 /100 | #302 | Tragic $37,072 |
| Paiute | 0.1 /100 | #303 | Tragic $37,066 |
| Hondurans | 0.1 /100 | #304 | Tragic $37,031 |
| Inupiat | 0.1 /100 | #305 | Tragic $36,999 |
| Immigrants | Haiti | 0.0 /100 | #306 | Tragic $36,849 |
| Immigrants | Latin America | 0.0 /100 | #307 | Tragic $36,823 |
| Fijians | 0.0 /100 | #308 | Tragic $36,690 |
| Immigrants | Honduras | 0.0 /100 | #309 | Tragic $36,665 |
| Ute | 0.0 /100 | #310 | Tragic $36,651 |
| Chippewa | 0.0 /100 | #311 | Tragic $36,631 |