Potawatomi vs Immigrants from Sudan 3rd Grade
COMPARE
Potawatomi
Immigrants from Sudan
3rd Grade
3rd Grade Comparison
Potawatomi
Immigrants from Sudan
98.1%
3RD GRADE
98.9/ 100
METRIC RATING
86th/ 347
METRIC RANK
97.5%
3RD GRADE
3.4/ 100
METRIC RATING
227th/ 347
METRIC RANK
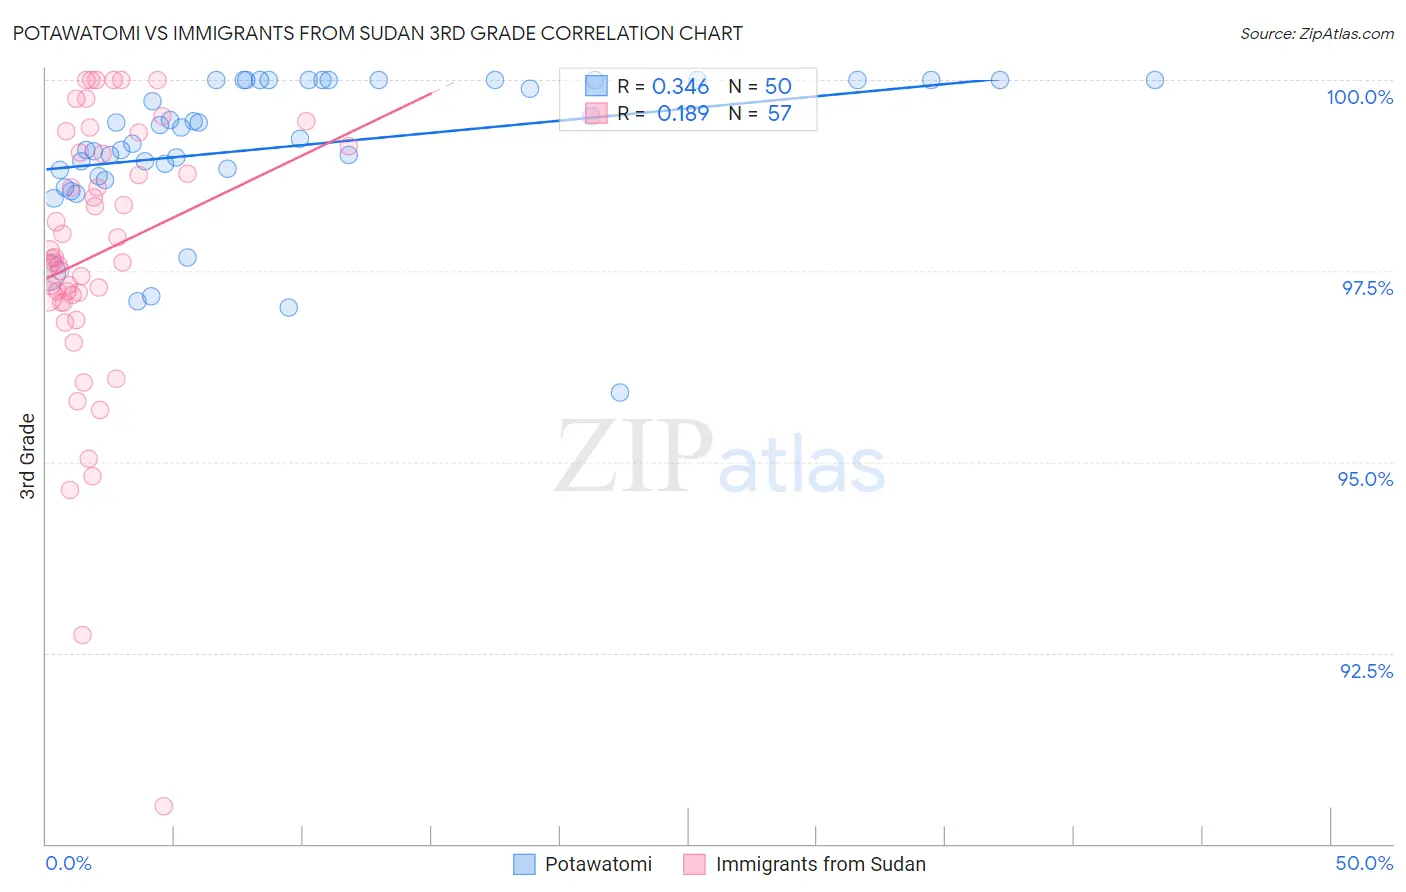
Potawatomi vs Immigrants from Sudan 3rd Grade Correlation Chart
The statistical analysis conducted on geographies consisting of 117,769,196 people shows a mild positive correlation between the proportion of Potawatomi and percentage of population with at least 3rd grade education in the United States with a correlation coefficient (R) of 0.346 and weighted average of 98.1%. Similarly, the statistical analysis conducted on geographies consisting of 118,965,188 people shows a poor positive correlation between the proportion of Immigrants from Sudan and percentage of population with at least 3rd grade education in the United States with a correlation coefficient (R) of 0.189 and weighted average of 97.5%, a difference of 0.66%.
3rd Grade Correlation Summary
| Measurement | Potawatomi | Immigrants from Sudan |
| Minimum | 95.9% | 90.5% |
| Maximum | 100.0% | 100.0% |
| Range | 4.1% | 9.5% |
| Mean | 99.1% | 97.7% |
| Median | 99.3% | 97.7% |
| Interquartile 25% (IQ1) | 98.8% | 97.1% |
| Interquartile 75% (IQ3) | 100.0% | 99.1% |
| Interquartile Range (IQR) | 1.2% | 2.0% |
| Standard Deviation (Sample) | 0.94% | 1.8% |
| Standard Deviation (Population) | 0.93% | 1.8% |
Similar Demographics by 3rd Grade
Demographics Similar to Potawatomi by 3rd Grade
In terms of 3rd grade, the demographic groups most similar to Potawatomi are Immigrants from Sweden (98.1%, a difference of 0.0%), Immigrants from Australia (98.1%, a difference of 0.0%), Immigrants from Denmark (98.1%, a difference of 0.0%), Immigrants from India (98.1%, a difference of 0.0%), and Delaware (98.1%, a difference of 0.0%).
| Demographics | Rating | Rank | 3rd Grade |
| Immigrants | Belgium | 99.1 /100 | #79 | Exceptional 98.1% |
| Macedonians | 99.1 /100 | #80 | Exceptional 98.1% |
| Icelanders | 99.1 /100 | #81 | Exceptional 98.1% |
| Shoshone | 99.0 /100 | #82 | Exceptional 98.1% |
| Ukrainians | 98.9 /100 | #83 | Exceptional 98.1% |
| Immigrants | Sweden | 98.9 /100 | #84 | Exceptional 98.1% |
| Immigrants | Australia | 98.9 /100 | #85 | Exceptional 98.1% |
| Potawatomi | 98.9 /100 | #86 | Exceptional 98.1% |
| Immigrants | Denmark | 98.8 /100 | #87 | Exceptional 98.1% |
| Immigrants | India | 98.8 /100 | #88 | Exceptional 98.1% |
| Delaware | 98.8 /100 | #89 | Exceptional 98.1% |
| Zimbabweans | 98.8 /100 | #90 | Exceptional 98.1% |
| Hopi | 98.7 /100 | #91 | Exceptional 98.1% |
| Immigrants | South Africa | 98.7 /100 | #92 | Exceptional 98.1% |
| Immigrants | Western Europe | 98.7 /100 | #93 | Exceptional 98.1% |
Demographics Similar to Immigrants from Sudan by 3rd Grade
In terms of 3rd grade, the demographic groups most similar to Immigrants from Sudan are Subsaharan African (97.5%, a difference of 0.010%), Senegalese (97.5%, a difference of 0.010%), Immigrants from Syria (97.5%, a difference of 0.020%), Bahamian (97.5%, a difference of 0.020%), and Tongan (97.5%, a difference of 0.020%).
| Demographics | Rating | Rank | 3rd Grade |
| Immigrants | Morocco | 5.0 /100 | #220 | Tragic 97.5% |
| Uruguayans | 5.0 /100 | #221 | Tragic 97.5% |
| Sierra Leoneans | 4.6 /100 | #222 | Tragic 97.5% |
| Immigrants | Syria | 4.4 /100 | #223 | Tragic 97.5% |
| Bahamians | 4.4 /100 | #224 | Tragic 97.5% |
| Tongans | 4.3 /100 | #225 | Tragic 97.5% |
| Sudanese | 4.1 /100 | #226 | Tragic 97.5% |
| Immigrants | Sudan | 3.4 /100 | #227 | Tragic 97.5% |
| Sub-Saharan Africans | 3.2 /100 | #228 | Tragic 97.5% |
| Senegalese | 3.0 /100 | #229 | Tragic 97.5% |
| Immigrants | Pakistan | 2.7 /100 | #230 | Tragic 97.5% |
| Immigrants | Costa Rica | 2.7 /100 | #231 | Tragic 97.5% |
| Immigrants | Western Asia | 2.6 /100 | #232 | Tragic 97.5% |
| Immigrants | Malaysia | 2.4 /100 | #233 | Tragic 97.5% |
| Immigrants | Eastern Asia | 1.9 /100 | #234 | Tragic 97.4% |