Potawatomi vs Immigrants from China Single Female Poverty
COMPARE
Potawatomi
Immigrants from China
Single Female Poverty
Single Female Poverty Comparison
Potawatomi
Immigrants from China
25.4%
SINGLE FEMALE POVERTY
0.0/ 100
METRIC RATING
307th/ 347
METRIC RANK
18.1%
SINGLE FEMALE POVERTY
100.0/ 100
METRIC RATING
19th/ 347
METRIC RANK
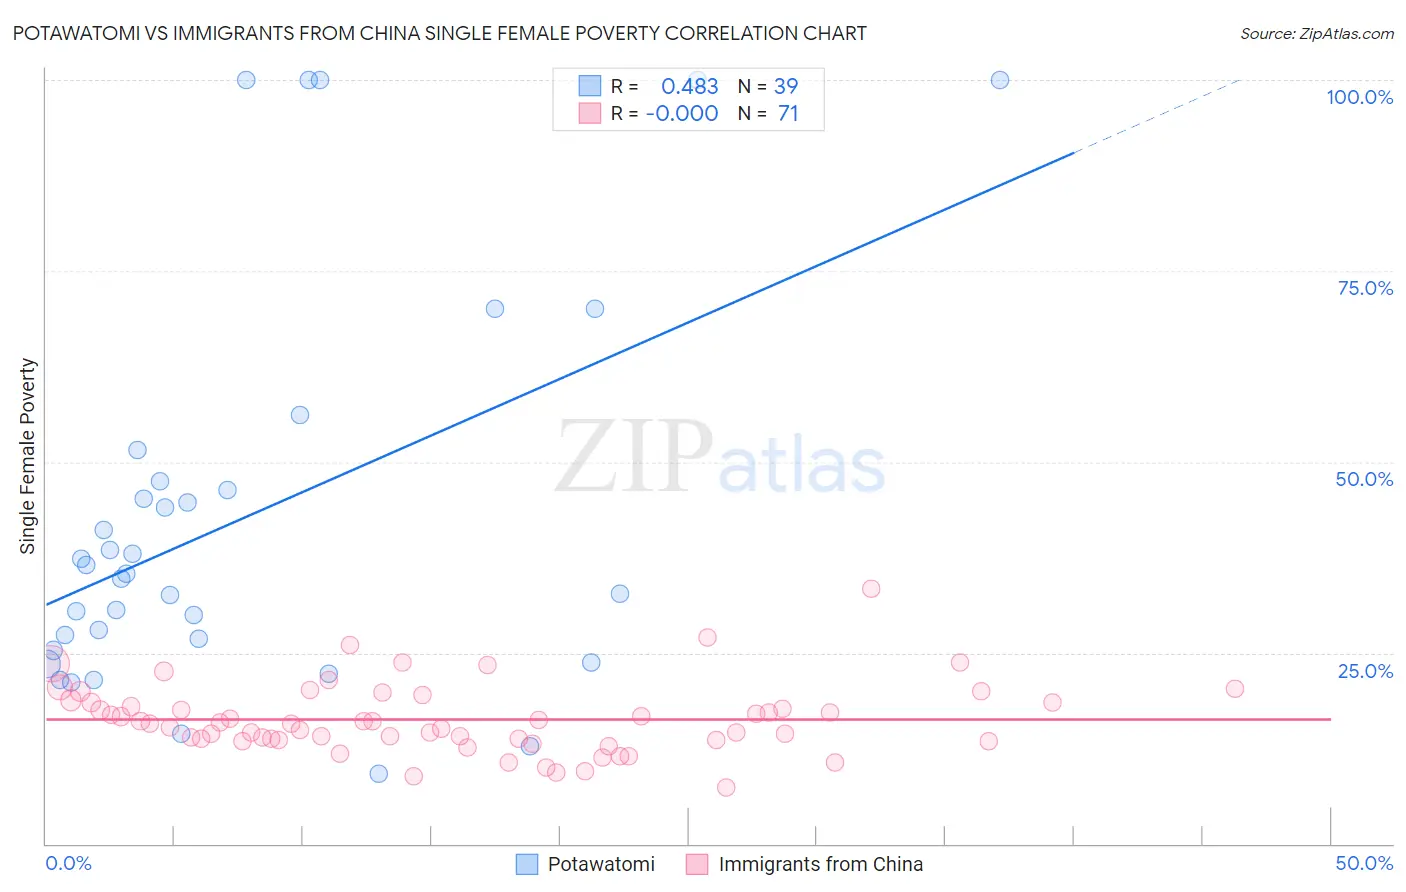
Potawatomi vs Immigrants from China Single Female Poverty Correlation Chart
The statistical analysis conducted on geographies consisting of 117,128,291 people shows a moderate positive correlation between the proportion of Potawatomi and poverty level among single females in the United States with a correlation coefficient (R) of 0.483 and weighted average of 25.4%. Similarly, the statistical analysis conducted on geographies consisting of 446,922,860 people shows no correlation between the proportion of Immigrants from China and poverty level among single females in the United States with a correlation coefficient (R) of -0.000 and weighted average of 18.1%, a difference of 39.9%.
Single Female Poverty Correlation Summary
| Measurement | Potawatomi | Immigrants from China |
| Minimum | 9.1% | 7.4% |
| Maximum | 100.0% | 33.3% |
| Range | 90.9% | 25.9% |
| Mean | 42.8% | 16.3% |
| Median | 35.3% | 15.7% |
| Interquartile 25% (IQ1) | 25.3% | 13.6% |
| Interquartile 75% (IQ3) | 47.5% | 18.6% |
| Interquartile Range (IQR) | 22.2% | 4.9% |
| Standard Deviation (Sample) | 25.9% | 4.6% |
| Standard Deviation (Population) | 25.5% | 4.5% |
Similar Demographics by Single Female Poverty
Demographics Similar to Potawatomi by Single Female Poverty
In terms of single female poverty, the demographic groups most similar to Potawatomi are Aleut (25.4%, a difference of 0.17%), Dominican (25.4%, a difference of 0.18%), Immigrants from Mexico (25.3%, a difference of 0.23%), Immigrants from Dominican Republic (25.3%, a difference of 0.32%), and Central American Indian (25.5%, a difference of 0.33%).
| Demographics | Rating | Rank | Single Female Poverty |
| Blackfeet | 0.0 /100 | #300 | Tragic 25.1% |
| Hondurans | 0.0 /100 | #301 | Tragic 25.1% |
| Shoshone | 0.0 /100 | #302 | Tragic 25.1% |
| Somalis | 0.0 /100 | #303 | Tragic 25.2% |
| Immigrants | Congo | 0.0 /100 | #304 | Tragic 25.3% |
| Immigrants | Dominican Republic | 0.0 /100 | #305 | Tragic 25.3% |
| Immigrants | Mexico | 0.0 /100 | #306 | Tragic 25.3% |
| Potawatomi | 0.0 /100 | #307 | Tragic 25.4% |
| Aleuts | 0.0 /100 | #308 | Tragic 25.4% |
| Dominicans | 0.0 /100 | #309 | Tragic 25.4% |
| Central American Indians | 0.0 /100 | #310 | Tragic 25.5% |
| Immigrants | Honduras | 0.0 /100 | #311 | Tragic 25.5% |
| Paiute | 0.0 /100 | #312 | Tragic 25.5% |
| Comanche | 0.0 /100 | #313 | Tragic 25.6% |
| Cherokee | 0.0 /100 | #314 | Tragic 25.7% |
Demographics Similar to Immigrants from China by Single Female Poverty
In terms of single female poverty, the demographic groups most similar to Immigrants from China are Immigrants from Eastern Asia (18.1%, a difference of 0.030%), Immigrants from Korea (18.1%, a difference of 0.32%), Immigrants from Greece (18.3%, a difference of 0.68%), Maltese (18.3%, a difference of 0.74%), and Burmese (18.3%, a difference of 0.75%).
| Demographics | Rating | Rank | Single Female Poverty |
| Immigrants | South Central Asia | 100.0 /100 | #12 | Exceptional 17.8% |
| Immigrants | Bolivia | 100.0 /100 | #13 | Exceptional 17.8% |
| Bolivians | 100.0 /100 | #14 | Exceptional 17.9% |
| Indians (Asian) | 100.0 /100 | #15 | Exceptional 17.9% |
| Iranians | 100.0 /100 | #16 | Exceptional 18.0% |
| Immigrants | Korea | 100.0 /100 | #17 | Exceptional 18.1% |
| Immigrants | Eastern Asia | 100.0 /100 | #18 | Exceptional 18.1% |
| Immigrants | China | 100.0 /100 | #19 | Exceptional 18.1% |
| Immigrants | Greece | 100.0 /100 | #20 | Exceptional 18.3% |
| Maltese | 100.0 /100 | #21 | Exceptional 18.3% |
| Burmese | 100.0 /100 | #22 | Exceptional 18.3% |
| Asians | 100.0 /100 | #23 | Exceptional 18.3% |
| Armenians | 100.0 /100 | #24 | Exceptional 18.3% |
| Immigrants | Singapore | 100.0 /100 | #25 | Exceptional 18.3% |
| Immigrants | Israel | 100.0 /100 | #26 | Exceptional 18.3% |