Potawatomi vs Swiss Single Female Poverty
COMPARE
Potawatomi
Swiss
Single Female Poverty
Single Female Poverty Comparison
Potawatomi
Swiss
25.4%
SINGLE FEMALE POVERTY
0.0/ 100
METRIC RATING
307th/ 347
METRIC RANK
21.4%
SINGLE FEMALE POVERTY
24.2/ 100
METRIC RATING
198th/ 347
METRIC RANK
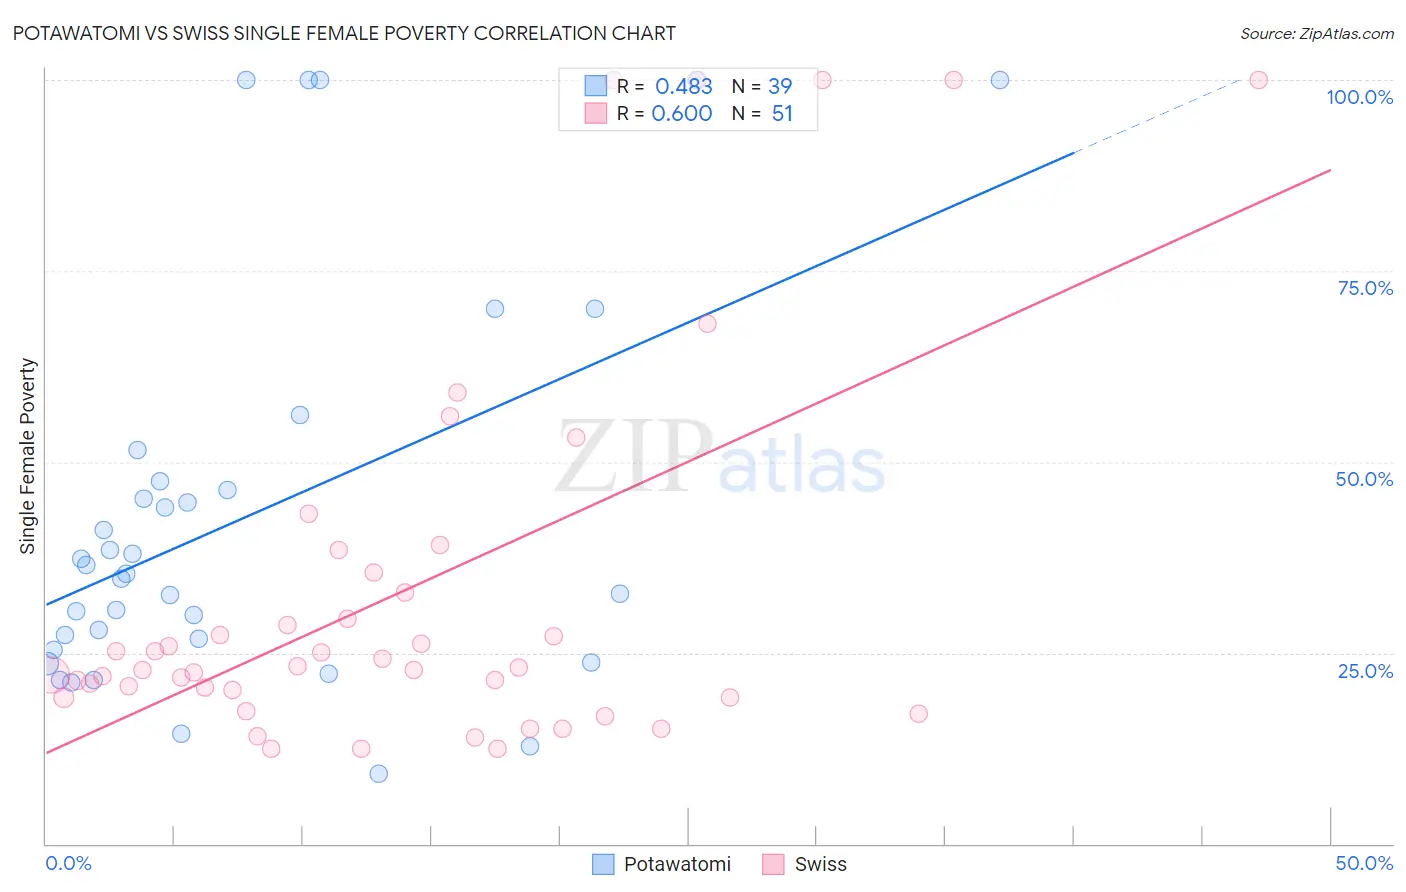
Potawatomi vs Swiss Single Female Poverty Correlation Chart
The statistical analysis conducted on geographies consisting of 117,128,291 people shows a moderate positive correlation between the proportion of Potawatomi and poverty level among single females in the United States with a correlation coefficient (R) of 0.483 and weighted average of 25.4%. Similarly, the statistical analysis conducted on geographies consisting of 453,637,180 people shows a substantial positive correlation between the proportion of Swiss and poverty level among single females in the United States with a correlation coefficient (R) of 0.600 and weighted average of 21.4%, a difference of 18.7%.
Single Female Poverty Correlation Summary
| Measurement | Potawatomi | Swiss |
| Minimum | 9.1% | 12.5% |
| Maximum | 100.0% | 100.0% |
| Range | 90.9% | 87.5% |
| Mean | 42.8% | 33.2% |
| Median | 35.3% | 23.1% |
| Interquartile 25% (IQ1) | 25.3% | 19.2% |
| Interquartile 75% (IQ3) | 47.5% | 35.5% |
| Interquartile Range (IQR) | 22.2% | 16.3% |
| Standard Deviation (Sample) | 25.9% | 25.2% |
| Standard Deviation (Population) | 25.5% | 25.0% |
Similar Demographics by Single Female Poverty
Demographics Similar to Potawatomi by Single Female Poverty
In terms of single female poverty, the demographic groups most similar to Potawatomi are Aleut (25.4%, a difference of 0.17%), Dominican (25.4%, a difference of 0.18%), Immigrants from Mexico (25.3%, a difference of 0.23%), Immigrants from Dominican Republic (25.3%, a difference of 0.32%), and Central American Indian (25.5%, a difference of 0.33%).
| Demographics | Rating | Rank | Single Female Poverty |
| Blackfeet | 0.0 /100 | #300 | Tragic 25.1% |
| Hondurans | 0.0 /100 | #301 | Tragic 25.1% |
| Shoshone | 0.0 /100 | #302 | Tragic 25.1% |
| Somalis | 0.0 /100 | #303 | Tragic 25.2% |
| Immigrants | Congo | 0.0 /100 | #304 | Tragic 25.3% |
| Immigrants | Dominican Republic | 0.0 /100 | #305 | Tragic 25.3% |
| Immigrants | Mexico | 0.0 /100 | #306 | Tragic 25.3% |
| Potawatomi | 0.0 /100 | #307 | Tragic 25.4% |
| Aleuts | 0.0 /100 | #308 | Tragic 25.4% |
| Dominicans | 0.0 /100 | #309 | Tragic 25.4% |
| Central American Indians | 0.0 /100 | #310 | Tragic 25.5% |
| Immigrants | Honduras | 0.0 /100 | #311 | Tragic 25.5% |
| Paiute | 0.0 /100 | #312 | Tragic 25.5% |
| Comanche | 0.0 /100 | #313 | Tragic 25.6% |
| Cherokee | 0.0 /100 | #314 | Tragic 25.7% |
Demographics Similar to Swiss by Single Female Poverty
In terms of single female poverty, the demographic groups most similar to Swiss are Japanese (21.3%, a difference of 0.17%), Immigrants (21.4%, a difference of 0.19%), Immigrants from Saudi Arabia (21.3%, a difference of 0.23%), Irish (21.4%, a difference of 0.25%), and Nicaraguan (21.3%, a difference of 0.27%).
| Demographics | Rating | Rank | Single Female Poverty |
| Immigrants | Germany | 31.1 /100 | #191 | Fair 21.3% |
| Immigrants | Jamaica | 30.5 /100 | #192 | Fair 21.3% |
| Basques | 28.1 /100 | #193 | Fair 21.3% |
| Czechoslovakians | 27.7 /100 | #194 | Fair 21.3% |
| Nicaraguans | 27.6 /100 | #195 | Fair 21.3% |
| Immigrants | Saudi Arabia | 27.1 /100 | #196 | Fair 21.3% |
| Japanese | 26.4 /100 | #197 | Fair 21.3% |
| Swiss | 24.2 /100 | #198 | Fair 21.4% |
| Immigrants | Immigrants | 22.0 /100 | #199 | Fair 21.4% |
| Irish | 21.4 /100 | #200 | Fair 21.4% |
| Nigerians | 20.9 /100 | #201 | Fair 21.4% |
| Immigrants | Kenya | 20.7 /100 | #202 | Fair 21.4% |
| Immigrants | Haiti | 18.8 /100 | #203 | Poor 21.5% |
| Immigrants | Africa | 16.7 /100 | #204 | Poor 21.5% |
| Finns | 16.2 /100 | #205 | Poor 21.5% |