Potawatomi vs Immigrants from China 6th Grade

COMPARE

Potawatomi
Race
Ancestry
AfghanAfricanAlaska NativeAlaskan AthabascanAlbanianAleutAlsatianAmericanApacheArabArapahoArgentineanArmenianAssyrian/Chaldean/SyriacAustralianAustrianBahamianBangladeshiBarbadianBasqueBelgianBelizeanBermudanBhutaneseBlackfeetBolivianBrazilianBritishBritish West IndianBulgarianBurmeseCajunCambodianCanadianCape VerdeanCarpatho RusynCelticCentral AmericanCentral American IndianCherokeeCheyenneChickasawChileanChineseChippewaChoctawColombianColvilleComancheCosta RicanCreeCreekCroatianCrowCubanCypriotCzechCzechoslovakianDanishDelawareDominicanDutchDutch West IndianEastern EuropeanEcuadorianEgyptianEnglishEstonianEthiopianEuropeanFijianFilipinoFinnishFrenchFrench American IndianFrench CanadianGermanGerman RussianGhanaianGreekGuamanian/ChamorroGuatemalanGuyaneseHaitianHmongHonduranHopiHoumaHungarianIcelanderIndian (Asian)IndonesianInupiatIranianIraqiIrishIroquoisIsraeliItalianJamaicanJapaneseJordanianKenyanKiowaKoreanLaotianLatvianLebaneseLiberianLithuanianLumbeeLuxembourgerMacedonianMalaysianMalteseMarshalleseMenomineeMexicanMexican American IndianMongolianMoroccanNative HawaiianNavajoNepaleseNew ZealanderNicaraguanNigerianNorthern EuropeanNorwegianOkinawanOsageOttawaPaiutePakistaniPalestinianPanamanianParaguayanPennsylvania GermanPeruvianPimaPolishPortuguesePotawatomiPuebloPuerto RicanPuget Sound SalishRomanianRussianSalvadoranSamoanScandinavianScotch-IrishScottishSeminoleSenegaleseSerbianShoshoneSierra LeoneanSiouxSlavicSlovakSloveneSomaliSouth AfricanSouth AmericanSouth American IndianSoviet UnionSpaniardSpanishSpanish AmericanSpanish American IndianSri LankanSubsaharan AfricanSudaneseSwedishSwissSyrianTaiwaneseThaiTlingit-HaidaTohono O'OdhamTonganTrinidadian and TobagonianTsimshianTurkishU.S. Virgin IslanderUgandanUkrainianUruguayanUteVenezuelanVietnameseWelshWest IndianYakamaYaquiYugoslavianYumanYup'ikZimbabwean
Immigration
NonimmigrantsImmigrantsAfghanistanAfricaAlbaniaArgentinaArmeniaAsiaAustraliaAustriaBahamasBangladeshBarbadosBelarusBelgiumBelizeBoliviaBosnia and HerzegovinaBrazilBulgariaBurma/MyanmarCabo VerdeCambodiaCameroonCanadaCaribbeanCentral AmericaChileColombiaCongoCosta RicaCroatiaCubaCzechoslovakiaDenmarkDominicaDominican RepublicEastern AfricaEastern AsiaEastern EuropeEcuadorEgyptEl SalvadorEnglandEritreaEthiopiaEuropeFijiFranceGermanyGhanaGreeceGrenadaGuatemalaGuyanaHaitiHondurasHong KongHungaryIndiaIndonesiaIranIraqIrelandIsraelItalyJamaicaJapanJordanKazakhstanKenyaKoreaKuwaitLaosLatin AmericaLatviaLebanonLiberiaLithuaniaMalaysiaMexicoMicronesiaMiddle AfricaMoldovaMoroccoNepalNetherlandsNicaraguaNigeriaNorth AmericaNorth MacedoniaNorthern AfricaNorthern EuropeNorwayOceaniaPakistanPanamaPeruPhilippinesPolandPortugalRomaniaRussiaSaudi ArabiaScotlandSenegalSerbiaSierra LeoneSingaporeSomaliaSouth AfricaSouth AmericaSouth Central AsiaSouth Eastern AsiaSouthern EuropeSpainSri LankaSt. Vincent and the GrenadinesSudanSwedenSwitzerlandSyriaTaiwanThailandTrinidad and TobagoTurkeyUgandaUkraineUruguayUzbekistanVenezuelaVietnamWest IndiesWestern AfricaWestern AsiaWestern EuropeYemenZaireZimbabweAzores
Immigrants from China
Race
Ancestry
AfghanAfricanAlaska NativeAlaskan AthabascanAlbanianAleutAlsatianAmericanApacheArabArapahoArgentineanArmenianAssyrian/Chaldean/SyriacAustralianAustrianBahamianBangladeshiBarbadianBasqueBelgianBelizeanBermudanBhutaneseBlackfeetBolivianBrazilianBritishBritish West IndianBulgarianBurmeseCajunCambodianCanadianCape VerdeanCarpatho RusynCelticCentral AmericanCentral American IndianCherokeeCheyenneChickasawChileanChineseChippewaChoctawColombianColvilleComancheCosta RicanCreeCreekCroatianCrowCubanCypriotCzechCzechoslovakianDanishDelawareDominicanDutchDutch West IndianEastern EuropeanEcuadorianEgyptianEnglishEstonianEthiopianEuropeanFijianFilipinoFinnishFrenchFrench American IndianFrench CanadianGermanGerman RussianGhanaianGreekGuamanian/ChamorroGuatemalanGuyaneseHaitianHmongHonduranHopiHoumaHungarianIcelanderIndian (Asian)IndonesianInupiatIranianIraqiIrishIroquoisIsraeliItalianJamaicanJapaneseJordanianKenyanKiowaKoreanLaotianLatvianLebaneseLiberianLithuanianLumbeeLuxembourgerMacedonianMalaysianMalteseMarshalleseMenomineeMexicanMexican American IndianMongolianMoroccanNative HawaiianNavajoNepaleseNew ZealanderNicaraguanNigerianNorthern EuropeanNorwegianOkinawanOsageOttawaPaiutePakistaniPalestinianPanamanianParaguayanPennsylvania GermanPeruvianPimaPolishPortuguesePuebloPuerto RicanPuget Sound SalishRomanianRussianSalvadoranSamoanScandinavianScotch-IrishScottishSeminoleSenegaleseSerbianShoshoneSierra LeoneanSiouxSlavicSlovakSloveneSomaliSouth AfricanSouth AmericanSouth American IndianSoviet UnionSpaniardSpanishSpanish AmericanSpanish American IndianSri LankanSubsaharan AfricanSudaneseSwedishSwissSyrianTaiwaneseThaiTlingit-HaidaTohono O'OdhamTonganTrinidadian and TobagonianTsimshianTurkishU.S. Virgin IslanderUgandanUkrainianUruguayanUteVenezuelanVietnameseWelshWest IndianYakamaYaquiYugoslavianYumanYup'ikZimbabwean
Immigration
NonimmigrantsImmigrantsAfghanistanAfricaAlbaniaArgentinaArmeniaAsiaAustraliaAustriaBahamasBangladeshBarbadosBelarusBelgiumBelizeBoliviaBosnia and HerzegovinaBrazilBulgariaBurma/MyanmarCabo VerdeCambodiaCameroonCanadaCaribbeanCentral AmericaChileChinaColombiaCongoCosta RicaCroatiaCubaCzechoslovakiaDenmarkDominicaDominican RepublicEastern AfricaEastern AsiaEastern EuropeEcuadorEgyptEl SalvadorEnglandEritreaEthiopiaEuropeFijiFranceGermanyGhanaGreeceGrenadaGuatemalaGuyanaHaitiHondurasHong KongHungaryIndiaIndonesiaIranIraqIrelandIsraelItalyJamaicaJapanJordanKazakhstanKenyaKoreaKuwaitLaosLatin AmericaLatviaLebanonLiberiaLithuaniaMalaysiaMexicoMicronesiaMiddle AfricaMoldovaMoroccoNepalNetherlandsNicaraguaNigeriaNorth AmericaNorth MacedoniaNorthern AfricaNorthern EuropeNorwayOceaniaPakistanPanamaPeruPhilippinesPolandPortugalRomaniaRussiaSaudi ArabiaScotlandSenegalSerbiaSierra LeoneSingaporeSomaliaSouth AfricaSouth AmericaSouth Central AsiaSouth Eastern AsiaSouthern EuropeSpainSri LankaSt. Vincent and the GrenadinesSudanSwedenSwitzerlandSyriaTaiwanThailandTrinidad and TobagoTurkeyUgandaUkraineUruguayUzbekistanVenezuelaVietnamWest IndiesWestern AfricaWestern AsiaWestern EuropeYemenZaireZimbabweAzores
6th Grade
Income
Poverty
Unemployment
Labor Participation
Family Structure
Vehicle Availability
Education Level
Disability

6th Grade Comparison

Potawatomi

Immigrants from China

Exceptional
Tragic
97.6%
6TH GRADE
99.1/ 100
METRIC RATING
83rd/ 347
METRIC RANK
96.4%
6TH GRADE
0.4/ 100
METRIC RATING
258th/ 347
METRIC RANK

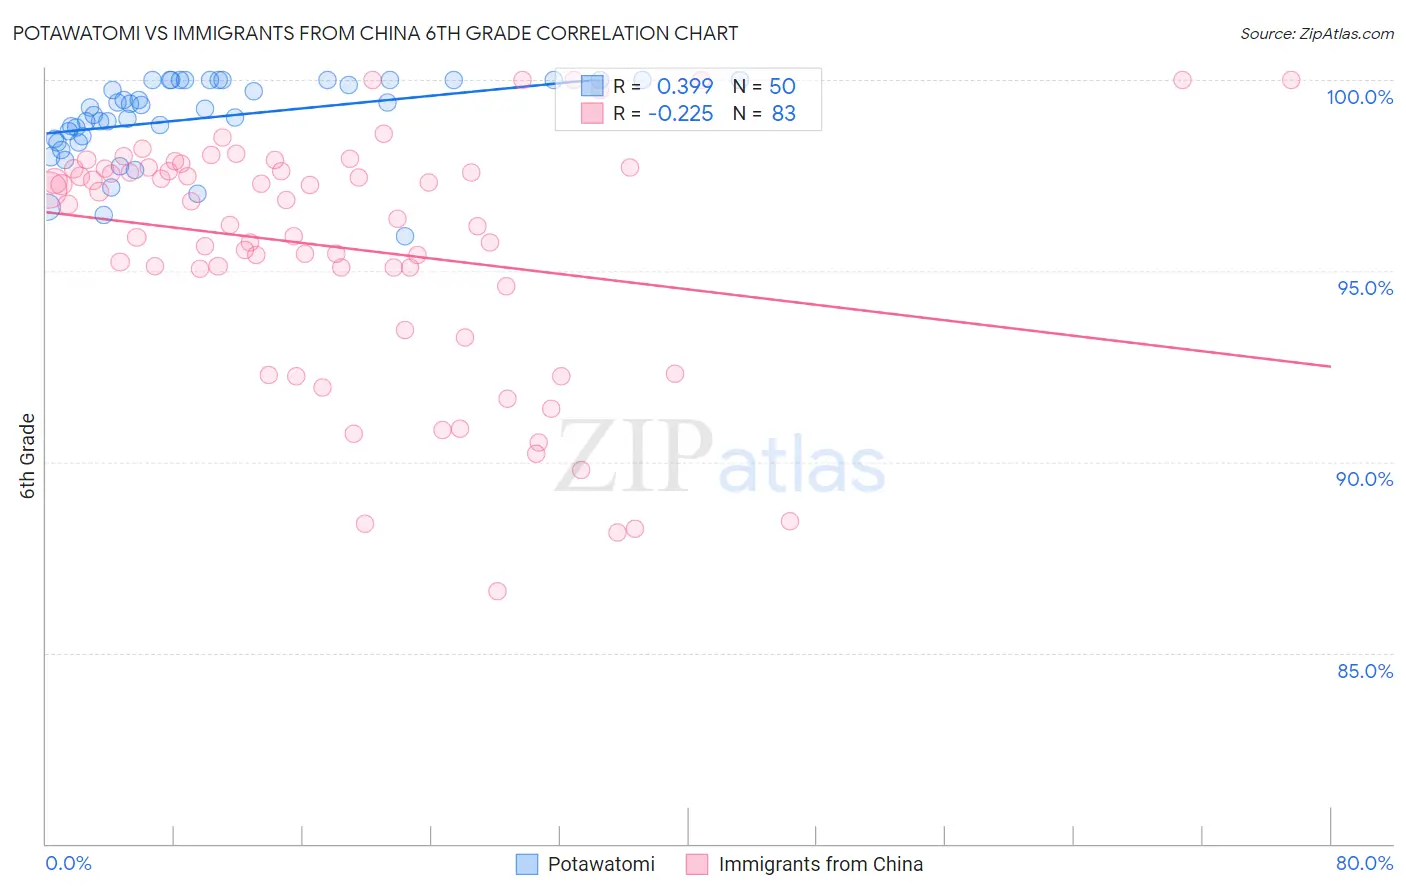
Potawatomi vs Immigrants from China 6th Grade Correlation Chart

The statistical analysis conducted on geographies consisting of 117,769,196 people shows a mild positive correlation between the proportion of Potawatomi and percentage of population with at least 6th grade education in the United States with a correlation coefficient (R) of 0.399 and weighted average of 97.6%. Similarly, the statistical analysis conducted on geographies consisting of 457,082,957 people shows a weak negative correlation between the proportion of Immigrants from China and percentage of population with at least 6th grade education in the United States with a correlation coefficient (R) of -0.225 and weighted average of 96.4%, a difference of 1.2%.
Potawatomi vs Immigrants from China 6th Grade

6th Grade Correlation Summary

MeasurementPotawatomiImmigrants from China
Minimum95.9%86.6%
Maximum100.0%100.0%
Range4.1%13.4%
Mean99.0%95.6%
Median99.3%96.7%
Interquartile 25% (IQ1)98.5%94.6%
Interquartile 75% (IQ3)100.0%97.7%
Interquartile Range (IQR)1.5%3.1%
Standard Deviation (Sample)1.1%3.2%
Standard Deviation (Population)1.0%3.2%

Similar Demographics by 6th Grade

Demographics Similar to Potawatomi by 6th Grade

In terms of 6th grade, the demographic groups most similar to Potawatomi are Lumbee (97.6%, a difference of 0.010%), Zimbabwean (97.6%, a difference of 0.010%), Shoshone (97.6%, a difference of 0.010%), Immigrants from India (97.6%, a difference of 0.020%), and Osage (97.6%, a difference of 0.020%).
DemographicsRating | Rank6th Grade
Immigrants | England
99.4
/100
|
#76
Exceptional
97.6%
Immigrants | Lithuania
99.3
/100
|
#77
Exceptional
97.6%
Icelanders
99.3
/100
|
#78
Exceptional
97.6%
Immigrants | India
99.3
/100
|
#79
Exceptional
97.6%
Osage
99.3
/100
|
#80
Exceptional
97.6%
Lumbee
99.2
/100
|
#81
Exceptional
97.6%
Zimbabweans
99.1
/100
|
#82
Exceptional
97.6%
Potawatomi
99.1
/100
|
#83
Exceptional
97.6%
Shoshone
99.0
/100
|
#84
Exceptional
97.6%
Delaware
98.9
/100
|
#85
Exceptional
97.6%
Immigrants | Belgium
98.9
/100
|
#86
Exceptional
97.5%
Puget Sound Salish
98.9
/100
|
#87
Exceptional
97.5%
Immigrants | South Africa
98.9
/100
|
#88
Exceptional
97.5%
Immigrants | Australia
98.8
/100
|
#89
Exceptional
97.5%
Pueblo
98.8
/100
|
#90
Exceptional
97.5%

Demographics Similar to Immigrants from China by 6th Grade

In terms of 6th grade, the demographic groups most similar to Immigrants from China are South American (96.4%, a difference of 0.0%), Taiwanese (96.5%, a difference of 0.010%), Peruvian (96.4%, a difference of 0.010%), Immigrants from Sierra Leone (96.4%, a difference of 0.010%), and Immigrants from Ethiopia (96.5%, a difference of 0.030%).
DemographicsRating | Rank6th Grade
Immigrants | Senegal
0.7
/100
|
#251
Tragic
96.5%
Immigrants | Uruguay
0.6
/100
|
#252
Tragic
96.5%
Jamaicans
0.6
/100
|
#253
Tragic
96.5%
Immigrants | Ethiopia
0.6
/100
|
#254
Tragic
96.5%
Immigrants | Congo
0.6
/100
|
#255
Tragic
96.5%
U.S. Virgin Islanders
0.5
/100
|
#256
Tragic
96.5%
Taiwanese
0.5
/100
|
#257
Tragic
96.5%
Immigrants | China
0.4
/100
|
#258
Tragic
96.4%
South Americans
0.4
/100
|
#259
Tragic
96.4%
Peruvians
0.4
/100
|
#260
Tragic
96.4%
Immigrants | Sierra Leone
0.4
/100
|
#261
Tragic
96.4%
Immigrants | Nigeria
0.3
/100
|
#262
Tragic
96.4%
Immigrants | Colombia
0.3
/100
|
#263
Tragic
96.4%
Armenians
0.3
/100
|
#264
Tragic
96.4%
Immigrants | Jamaica
0.2
/100
|
#265
Tragic
96.4%