Potawatomi vs Bangladeshi Single Male Poverty
COMPARE
Potawatomi
Bangladeshi
Single Male Poverty
Single Male Poverty Comparison
Potawatomi
Bangladeshis
15.8%
SINGLE MALE POVERTY
0.0/ 100
METRIC RATING
308th/ 347
METRIC RANK
13.3%
SINGLE MALE POVERTY
3.7/ 100
METRIC RATING
235th/ 347
METRIC RANK
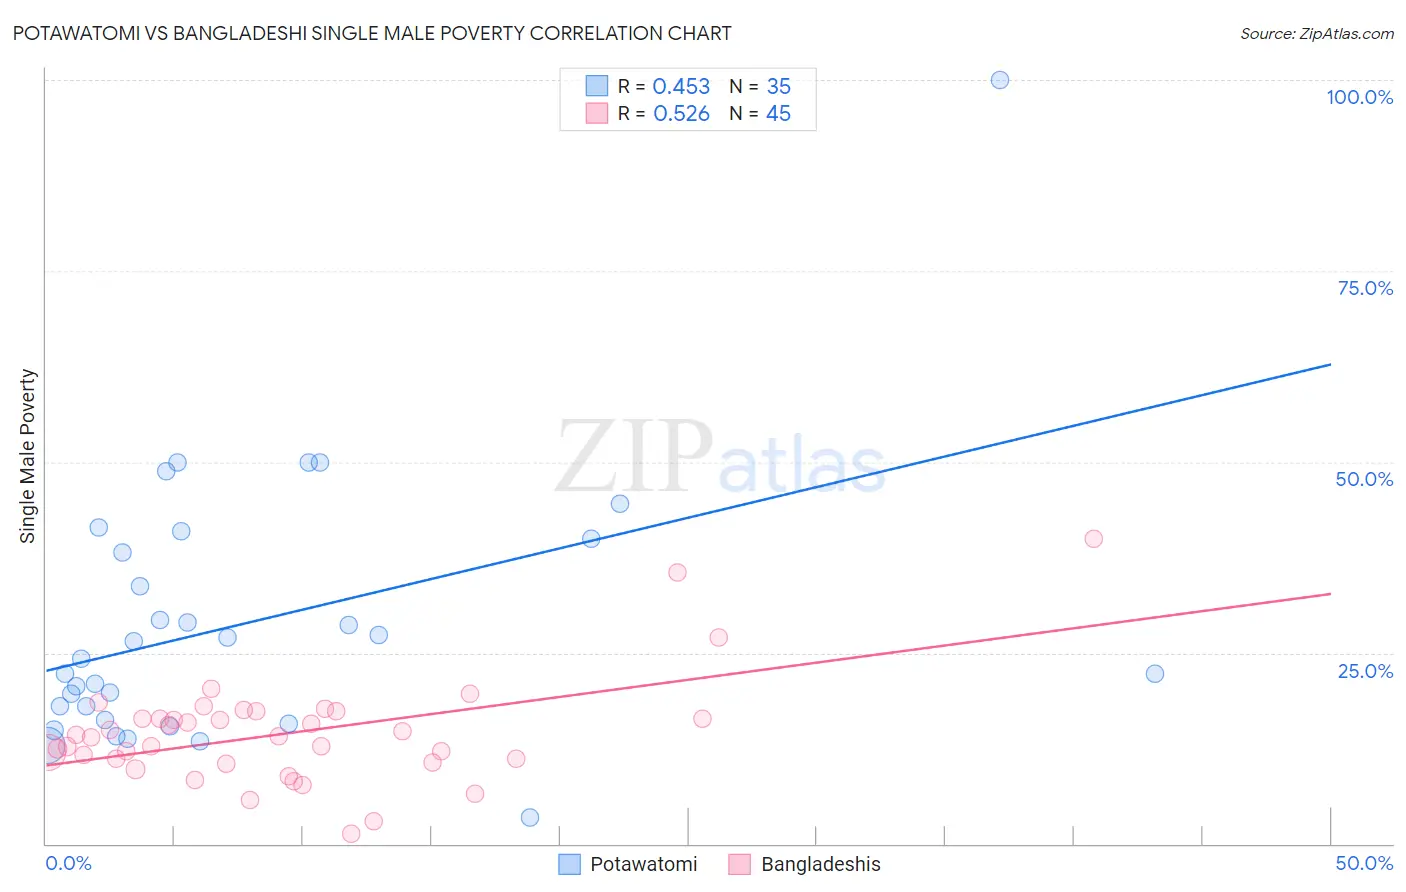
Potawatomi vs Bangladeshi Single Male Poverty Correlation Chart
The statistical analysis conducted on geographies consisting of 112,014,628 people shows a moderate positive correlation between the proportion of Potawatomi and poverty level among single males in the United States with a correlation coefficient (R) of 0.453 and weighted average of 15.8%. Similarly, the statistical analysis conducted on geographies consisting of 134,113,248 people shows a substantial positive correlation between the proportion of Bangladeshis and poverty level among single males in the United States with a correlation coefficient (R) of 0.526 and weighted average of 13.3%, a difference of 18.1%.
Single Male Poverty Correlation Summary
| Measurement | Potawatomi | Bangladeshi |
| Minimum | 3.4% | 1.3% |
| Maximum | 100.0% | 40.0% |
| Range | 96.6% | 38.7% |
| Mean | 28.9% | 14.5% |
| Median | 24.3% | 14.1% |
| Interquartile 25% (IQ1) | 16.3% | 10.9% |
| Interquartile 75% (IQ3) | 40.0% | 16.9% |
| Interquartile Range (IQR) | 23.7% | 5.9% |
| Standard Deviation (Sample) | 17.6% | 6.9% |
| Standard Deviation (Population) | 17.3% | 6.8% |
Similar Demographics by Single Male Poverty
Demographics Similar to Potawatomi by Single Male Poverty
In terms of single male poverty, the demographic groups most similar to Potawatomi are American (15.8%, a difference of 0.17%), Ute (15.7%, a difference of 0.57%), Yakama (15.9%, a difference of 1.0%), Pennsylvania German (15.6%, a difference of 1.3%), and Seminole (16.0%, a difference of 1.6%).
| Demographics | Rating | Rank | Single Male Poverty |
| Dominicans | 0.0 /100 | #301 | Tragic 15.2% |
| Alsatians | 0.0 /100 | #302 | Tragic 15.2% |
| Aleuts | 0.0 /100 | #303 | Tragic 15.4% |
| Alaska Natives | 0.0 /100 | #304 | Tragic 15.4% |
| Blackfeet | 0.0 /100 | #305 | Tragic 15.5% |
| Pennsylvania Germans | 0.0 /100 | #306 | Tragic 15.6% |
| Ute | 0.0 /100 | #307 | Tragic 15.7% |
| Potawatomi | 0.0 /100 | #308 | Tragic 15.8% |
| Americans | 0.0 /100 | #309 | Tragic 15.8% |
| Yakama | 0.0 /100 | #310 | Tragic 15.9% |
| Seminole | 0.0 /100 | #311 | Tragic 16.0% |
| Comanche | 0.0 /100 | #312 | Tragic 16.0% |
| Cherokee | 0.0 /100 | #313 | Tragic 16.1% |
| Alaskan Athabascans | 0.0 /100 | #314 | Tragic 16.1% |
| Cheyenne | 0.0 /100 | #315 | Tragic 16.1% |
Demographics Similar to Bangladeshis by Single Male Poverty
In terms of single male poverty, the demographic groups most similar to Bangladeshis are Luxembourger (13.4%, a difference of 0.050%), British (13.3%, a difference of 0.10%), Canadian (13.3%, a difference of 0.10%), British West Indian (13.4%, a difference of 0.11%), and Immigrants from Ghana (13.4%, a difference of 0.21%).
| Demographics | Rating | Rank | Single Male Poverty |
| Lebanese | 6.6 /100 | #228 | Tragic 13.2% |
| Europeans | 6.2 /100 | #229 | Tragic 13.3% |
| Ghanaians | 6.1 /100 | #230 | Tragic 13.3% |
| Slavs | 5.3 /100 | #231 | Tragic 13.3% |
| Immigrants | Caribbean | 5.0 /100 | #232 | Tragic 13.3% |
| British | 4.0 /100 | #233 | Tragic 13.3% |
| Canadians | 4.0 /100 | #234 | Tragic 13.3% |
| Bangladeshis | 3.7 /100 | #235 | Tragic 13.3% |
| Luxembourgers | 3.6 /100 | #236 | Tragic 13.4% |
| British West Indians | 3.4 /100 | #237 | Tragic 13.4% |
| Immigrants | Ghana | 3.2 /100 | #238 | Tragic 13.4% |
| Czechoslovakians | 3.0 /100 | #239 | Tragic 13.4% |
| Belizeans | 2.3 /100 | #240 | Tragic 13.4% |
| Immigrants | Germany | 2.1 /100 | #241 | Tragic 13.4% |
| Carpatho Rusyns | 2.1 /100 | #242 | Tragic 13.4% |