Potawatomi vs Iroquois Single Male Poverty
COMPARE
Potawatomi
Iroquois
Single Male Poverty
Single Male Poverty Comparison
Potawatomi
Iroquois
15.8%
SINGLE MALE POVERTY
0.0/ 100
METRIC RATING
308th/ 347
METRIC RANK
14.5%
SINGLE MALE POVERTY
0.0/ 100
METRIC RATING
287th/ 347
METRIC RANK
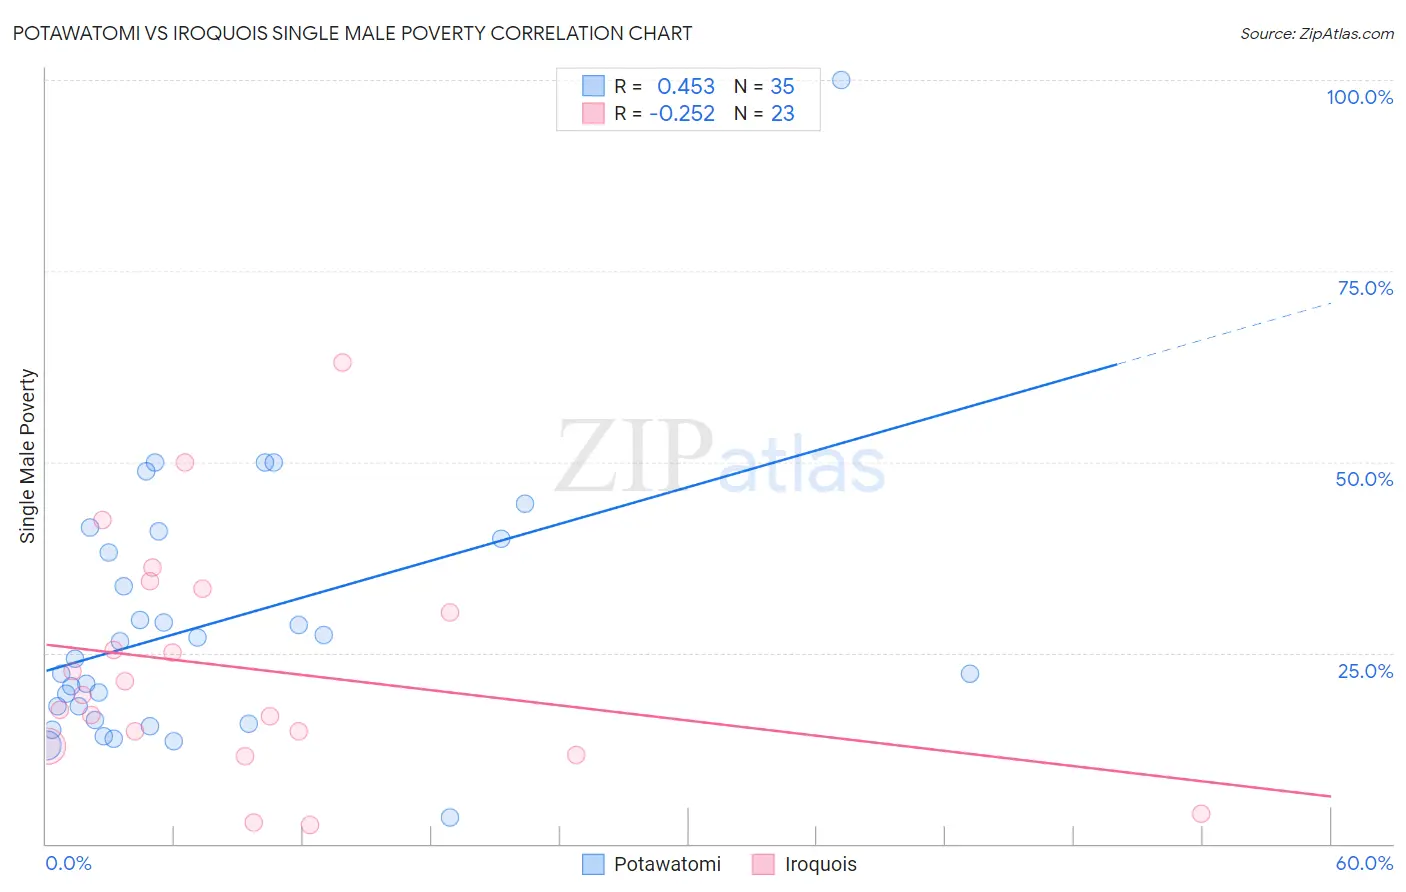
Potawatomi vs Iroquois Single Male Poverty Correlation Chart
The statistical analysis conducted on geographies consisting of 112,014,628 people shows a moderate positive correlation between the proportion of Potawatomi and poverty level among single males in the United States with a correlation coefficient (R) of 0.453 and weighted average of 15.8%. Similarly, the statistical analysis conducted on geographies consisting of 192,366,104 people shows a weak negative correlation between the proportion of Iroquois and poverty level among single males in the United States with a correlation coefficient (R) of -0.252 and weighted average of 14.5%, a difference of 8.9%.
Single Male Poverty Correlation Summary
| Measurement | Potawatomi | Iroquois |
| Minimum | 3.4% | 2.4% |
| Maximum | 100.0% | 63.0% |
| Range | 96.6% | 60.6% |
| Mean | 28.9% | 23.0% |
| Median | 24.3% | 19.4% |
| Interquartile 25% (IQ1) | 16.3% | 12.8% |
| Interquartile 75% (IQ3) | 40.0% | 33.3% |
| Interquartile Range (IQR) | 23.7% | 20.5% |
| Standard Deviation (Sample) | 17.6% | 15.1% |
| Standard Deviation (Population) | 17.3% | 14.7% |
Similar Demographics by Single Male Poverty
Demographics Similar to Potawatomi by Single Male Poverty
In terms of single male poverty, the demographic groups most similar to Potawatomi are American (15.8%, a difference of 0.17%), Ute (15.7%, a difference of 0.57%), Yakama (15.9%, a difference of 1.0%), Pennsylvania German (15.6%, a difference of 1.3%), and Seminole (16.0%, a difference of 1.6%).
| Demographics | Rating | Rank | Single Male Poverty |
| Dominicans | 0.0 /100 | #301 | Tragic 15.2% |
| Alsatians | 0.0 /100 | #302 | Tragic 15.2% |
| Aleuts | 0.0 /100 | #303 | Tragic 15.4% |
| Alaska Natives | 0.0 /100 | #304 | Tragic 15.4% |
| Blackfeet | 0.0 /100 | #305 | Tragic 15.5% |
| Pennsylvania Germans | 0.0 /100 | #306 | Tragic 15.6% |
| Ute | 0.0 /100 | #307 | Tragic 15.7% |
| Potawatomi | 0.0 /100 | #308 | Tragic 15.8% |
| Americans | 0.0 /100 | #309 | Tragic 15.8% |
| Yakama | 0.0 /100 | #310 | Tragic 15.9% |
| Seminole | 0.0 /100 | #311 | Tragic 16.0% |
| Comanche | 0.0 /100 | #312 | Tragic 16.0% |
| Cherokee | 0.0 /100 | #313 | Tragic 16.1% |
| Alaskan Athabascans | 0.0 /100 | #314 | Tragic 16.1% |
| Cheyenne | 0.0 /100 | #315 | Tragic 16.1% |
Demographics Similar to Iroquois by Single Male Poverty
In terms of single male poverty, the demographic groups most similar to Iroquois are White/Caucasian (14.5%, a difference of 0.0%), Immigrants from Dominica (14.5%, a difference of 0.090%), Celtic (14.5%, a difference of 0.13%), U.S. Virgin Islander (14.5%, a difference of 0.32%), and French (14.4%, a difference of 0.45%).
| Demographics | Rating | Rank | Single Male Poverty |
| Hmong | 0.0 /100 | #280 | Tragic 14.2% |
| Hispanics or Latinos | 0.0 /100 | #281 | Tragic 14.2% |
| Spanish Americans | 0.0 /100 | #282 | Tragic 14.2% |
| Yaqui | 0.0 /100 | #283 | Tragic 14.2% |
| Immigrants | Bahamas | 0.0 /100 | #284 | Tragic 14.4% |
| French | 0.0 /100 | #285 | Tragic 14.4% |
| Celtics | 0.0 /100 | #286 | Tragic 14.5% |
| Iroquois | 0.0 /100 | #287 | Tragic 14.5% |
| Whites/Caucasians | 0.0 /100 | #288 | Tragic 14.5% |
| Immigrants | Dominica | 0.0 /100 | #289 | Tragic 14.5% |
| U.S. Virgin Islanders | 0.0 /100 | #290 | Tragic 14.5% |
| Bahamians | 0.0 /100 | #291 | Tragic 14.6% |
| Immigrants | Nonimmigrants | 0.0 /100 | #292 | Tragic 14.6% |
| French Canadians | 0.0 /100 | #293 | Tragic 14.6% |
| Ottawa | 0.0 /100 | #294 | Tragic 14.6% |