Potawatomi vs Immigrants from Senegal Single Male Poverty
COMPARE
Potawatomi
Immigrants from Senegal
Single Male Poverty
Single Male Poverty Comparison
Potawatomi
Immigrants from Senegal
15.8%
SINGLE MALE POVERTY
0.0/ 100
METRIC RATING
308th/ 347
METRIC RANK
13.5%
SINGLE MALE POVERTY
1.7/ 100
METRIC RATING
244th/ 347
METRIC RANK
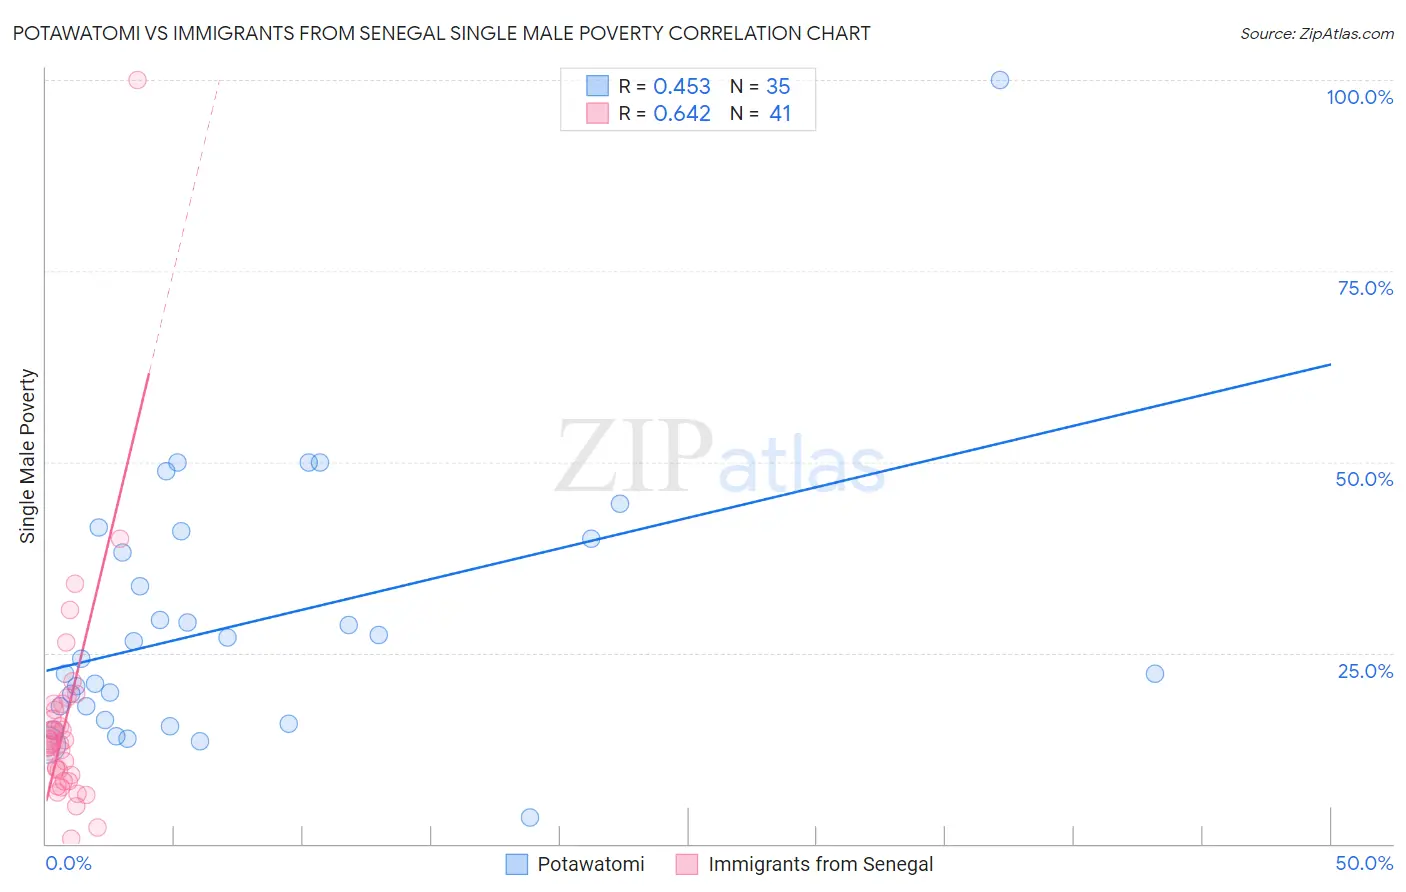
Potawatomi vs Immigrants from Senegal Single Male Poverty Correlation Chart
The statistical analysis conducted on geographies consisting of 112,014,628 people shows a moderate positive correlation between the proportion of Potawatomi and poverty level among single males in the United States with a correlation coefficient (R) of 0.453 and weighted average of 15.8%. Similarly, the statistical analysis conducted on geographies consisting of 87,233,263 people shows a significant positive correlation between the proportion of Immigrants from Senegal and poverty level among single males in the United States with a correlation coefficient (R) of 0.642 and weighted average of 13.5%, a difference of 16.9%.
Single Male Poverty Correlation Summary
| Measurement | Potawatomi | Immigrants from Senegal |
| Minimum | 3.4% | 0.68% |
| Maximum | 100.0% | 100.0% |
| Range | 96.6% | 99.3% |
| Mean | 28.9% | 16.1% |
| Median | 24.3% | 13.2% |
| Interquartile 25% (IQ1) | 16.3% | 8.6% |
| Interquartile 75% (IQ3) | 40.0% | 17.9% |
| Interquartile Range (IQR) | 23.7% | 9.3% |
| Standard Deviation (Sample) | 17.6% | 15.6% |
| Standard Deviation (Population) | 17.3% | 15.4% |
Similar Demographics by Single Male Poverty
Demographics Similar to Potawatomi by Single Male Poverty
In terms of single male poverty, the demographic groups most similar to Potawatomi are American (15.8%, a difference of 0.17%), Ute (15.7%, a difference of 0.57%), Yakama (15.9%, a difference of 1.0%), Pennsylvania German (15.6%, a difference of 1.3%), and Seminole (16.0%, a difference of 1.6%).
| Demographics | Rating | Rank | Single Male Poverty |
| Dominicans | 0.0 /100 | #301 | Tragic 15.2% |
| Alsatians | 0.0 /100 | #302 | Tragic 15.2% |
| Aleuts | 0.0 /100 | #303 | Tragic 15.4% |
| Alaska Natives | 0.0 /100 | #304 | Tragic 15.4% |
| Blackfeet | 0.0 /100 | #305 | Tragic 15.5% |
| Pennsylvania Germans | 0.0 /100 | #306 | Tragic 15.6% |
| Ute | 0.0 /100 | #307 | Tragic 15.7% |
| Potawatomi | 0.0 /100 | #308 | Tragic 15.8% |
| Americans | 0.0 /100 | #309 | Tragic 15.8% |
| Yakama | 0.0 /100 | #310 | Tragic 15.9% |
| Seminole | 0.0 /100 | #311 | Tragic 16.0% |
| Comanche | 0.0 /100 | #312 | Tragic 16.0% |
| Cherokee | 0.0 /100 | #313 | Tragic 16.1% |
| Alaskan Athabascans | 0.0 /100 | #314 | Tragic 16.1% |
| Cheyenne | 0.0 /100 | #315 | Tragic 16.1% |
Demographics Similar to Immigrants from Senegal by Single Male Poverty
In terms of single male poverty, the demographic groups most similar to Immigrants from Senegal are Immigrants from Latin America (13.5%, a difference of 0.26%), Barbadian (13.4%, a difference of 0.28%), Carpatho Rusyn (13.4%, a difference of 0.32%), Immigrants from Germany (13.4%, a difference of 0.33%), and Immigrants from Micronesia (13.5%, a difference of 0.36%).
| Demographics | Rating | Rank | Single Male Poverty |
| British West Indians | 3.4 /100 | #237 | Tragic 13.4% |
| Immigrants | Ghana | 3.2 /100 | #238 | Tragic 13.4% |
| Czechoslovakians | 3.0 /100 | #239 | Tragic 13.4% |
| Belizeans | 2.3 /100 | #240 | Tragic 13.4% |
| Immigrants | Germany | 2.1 /100 | #241 | Tragic 13.4% |
| Carpatho Rusyns | 2.1 /100 | #242 | Tragic 13.4% |
| Barbadians | 2.1 /100 | #243 | Tragic 13.4% |
| Immigrants | Senegal | 1.7 /100 | #244 | Tragic 13.5% |
| Immigrants | Latin America | 1.3 /100 | #245 | Tragic 13.5% |
| Immigrants | Micronesia | 1.2 /100 | #246 | Tragic 13.5% |
| Belgians | 1.2 /100 | #247 | Tragic 13.5% |
| Czechs | 1.2 /100 | #248 | Tragic 13.5% |
| Spanish | 1.0 /100 | #249 | Tragic 13.6% |
| Immigrants | Somalia | 1.0 /100 | #250 | Tragic 13.6% |
| Immigrants | Zaire | 0.9 /100 | #251 | Tragic 13.6% |