Welsh vs Immigrants from Venezuela Receiving Food Stamps
COMPARE
Welsh
Immigrants from Venezuela
Receiving Food Stamps
Receiving Food Stamps Comparison
Welsh
Immigrants from Venezuela
10.3%
RECEIVING FOOD STAMPS
97.3/ 100
METRIC RATING
96th/ 347
METRIC RANK
12.3%
RECEIVING FOOD STAMPS
20.1/ 100
METRIC RATING
202nd/ 347
METRIC RANK
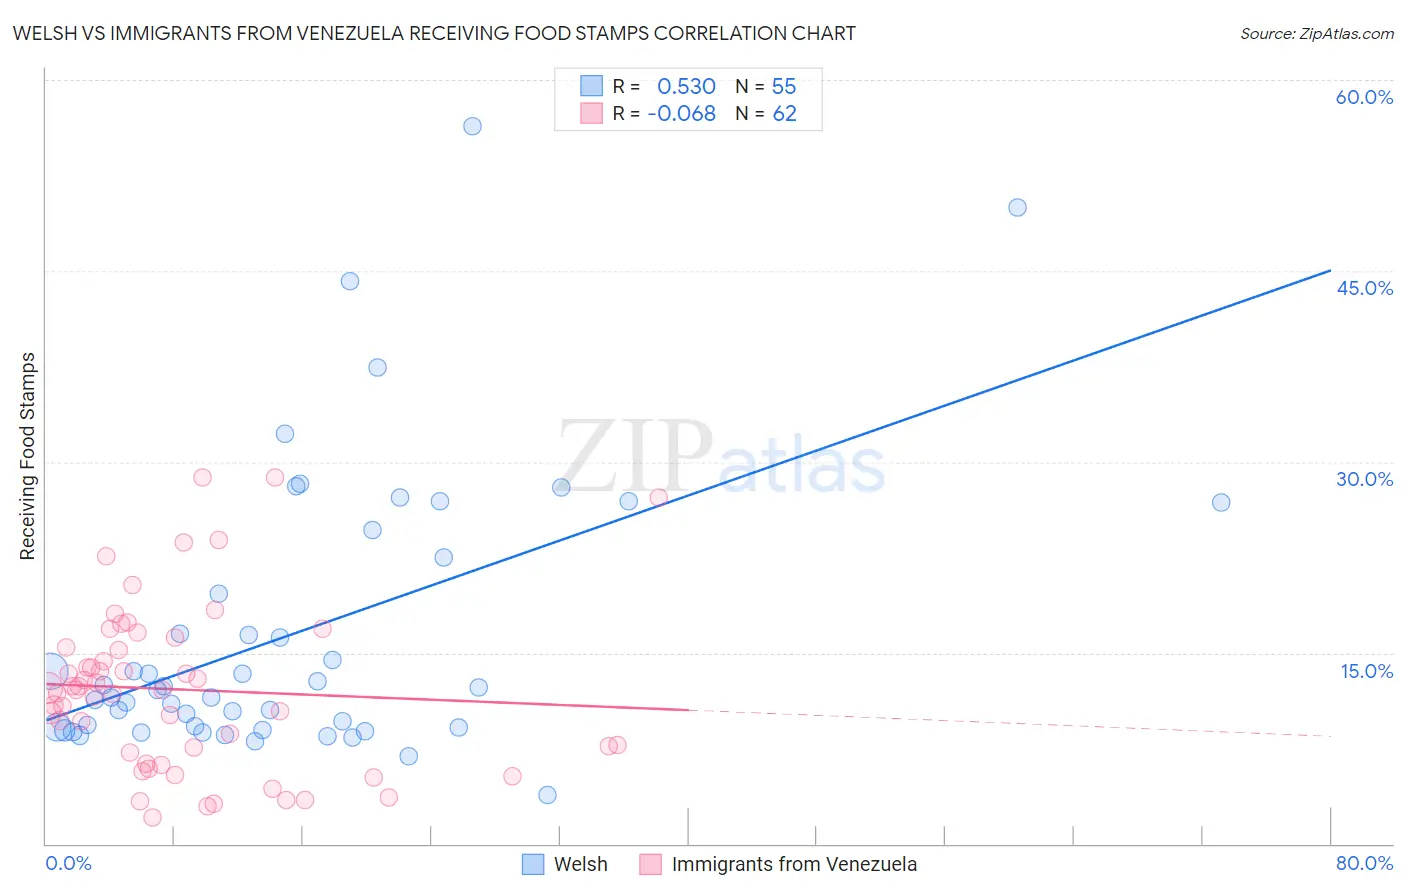
Welsh vs Immigrants from Venezuela Receiving Food Stamps Correlation Chart
The statistical analysis conducted on geographies consisting of 526,059,303 people shows a substantial positive correlation between the proportion of Welsh and percentage of population receiving government assistance and/or food stamps in the United States with a correlation coefficient (R) of 0.530 and weighted average of 10.3%. Similarly, the statistical analysis conducted on geographies consisting of 287,368,478 people shows a slight negative correlation between the proportion of Immigrants from Venezuela and percentage of population receiving government assistance and/or food stamps in the United States with a correlation coefficient (R) of -0.068 and weighted average of 12.3%, a difference of 19.9%.
Receiving Food Stamps Correlation Summary
| Measurement | Welsh | Immigrants from Venezuela |
| Minimum | 3.8% | 2.1% |
| Maximum | 56.4% | 28.8% |
| Range | 52.6% | 26.7% |
| Mean | 16.5% | 12.1% |
| Median | 12.1% | 12.1% |
| Interquartile 25% (IQ1) | 9.1% | 7.2% |
| Interquartile 75% (IQ3) | 22.5% | 15.5% |
| Interquartile Range (IQR) | 13.4% | 8.3% |
| Standard Deviation (Sample) | 11.2% | 6.4% |
| Standard Deviation (Population) | 11.1% | 6.4% |
Similar Demographics by Receiving Food Stamps
Demographics Similar to Welsh by Receiving Food Stamps
In terms of receiving food stamps, the demographic groups most similar to Welsh are Basque (10.3%, a difference of 0.050%), Immigrants from Greece (10.3%, a difference of 0.080%), Czechoslovakian (10.3%, a difference of 0.26%), Immigrants from Egypt (10.3%, a difference of 0.31%), and Serbian (10.3%, a difference of 0.49%).
| Demographics | Rating | Rank | Receiving Food Stamps |
| Immigrants | France | 98.3 /100 | #89 | Exceptional 10.1% |
| Finns | 97.9 /100 | #90 | Exceptional 10.2% |
| Jordanians | 97.9 /100 | #91 | Exceptional 10.2% |
| Irish | 97.9 /100 | #92 | Exceptional 10.2% |
| Belgians | 97.7 /100 | #93 | Exceptional 10.2% |
| Immigrants | Greece | 97.4 /100 | #94 | Exceptional 10.3% |
| Basques | 97.4 /100 | #95 | Exceptional 10.3% |
| Welsh | 97.3 /100 | #96 | Exceptional 10.3% |
| Czechoslovakians | 97.2 /100 | #97 | Exceptional 10.3% |
| Immigrants | Egypt | 97.1 /100 | #98 | Exceptional 10.3% |
| Serbians | 97.0 /100 | #99 | Exceptional 10.3% |
| Immigrants | Western Europe | 96.9 /100 | #100 | Exceptional 10.3% |
| Palestinians | 96.9 /100 | #101 | Exceptional 10.3% |
| Immigrants | Europe | 96.8 /100 | #102 | Exceptional 10.3% |
| Immigrants | Latvia | 96.8 /100 | #103 | Exceptional 10.3% |
Demographics Similar to Immigrants from Venezuela by Receiving Food Stamps
In terms of receiving food stamps, the demographic groups most similar to Immigrants from Venezuela are Ugandan (12.2%, a difference of 0.48%), Shoshone (12.4%, a difference of 0.53%), Nonimmigrants (12.4%, a difference of 0.56%), Aleut (12.4%, a difference of 0.62%), and Sierra Leonean (12.2%, a difference of 0.68%).
| Demographics | Rating | Rank | Receiving Food Stamps |
| Americans | 26.7 /100 | #195 | Fair 12.2% |
| Iraqis | 26.6 /100 | #196 | Fair 12.2% |
| Delaware | 26.1 /100 | #197 | Fair 12.2% |
| Immigrants | Costa Rica | 25.4 /100 | #198 | Fair 12.2% |
| Portuguese | 25.1 /100 | #199 | Fair 12.2% |
| Sierra Leoneans | 23.6 /100 | #200 | Fair 12.2% |
| Ugandans | 22.5 /100 | #201 | Fair 12.2% |
| Immigrants | Venezuela | 20.1 /100 | #202 | Fair 12.3% |
| Shoshone | 17.7 /100 | #203 | Poor 12.4% |
| Immigrants | Nonimmigrants | 17.6 /100 | #204 | Poor 12.4% |
| Aleuts | 17.3 /100 | #205 | Poor 12.4% |
| Immigrants | Thailand | 17.0 /100 | #206 | Poor 12.4% |
| South Americans | 16.0 /100 | #207 | Poor 12.4% |
| Potawatomi | 14.6 /100 | #208 | Poor 12.5% |
| Immigrants | Sierra Leone | 12.9 /100 | #209 | Poor 12.5% |