Peruvian vs Immigrants from South Central Asia Master's Degree
COMPARE
Peruvian
Immigrants from South Central Asia
Master's Degree
Master's Degree Comparison
Peruvians
Immigrants from South Central Asia
15.3%
MASTER'S DEGREE
68.7/ 100
METRIC RATING
162nd/ 347
METRIC RANK
20.7%
MASTER'S DEGREE
100.0/ 100
METRIC RATING
17th/ 347
METRIC RANK
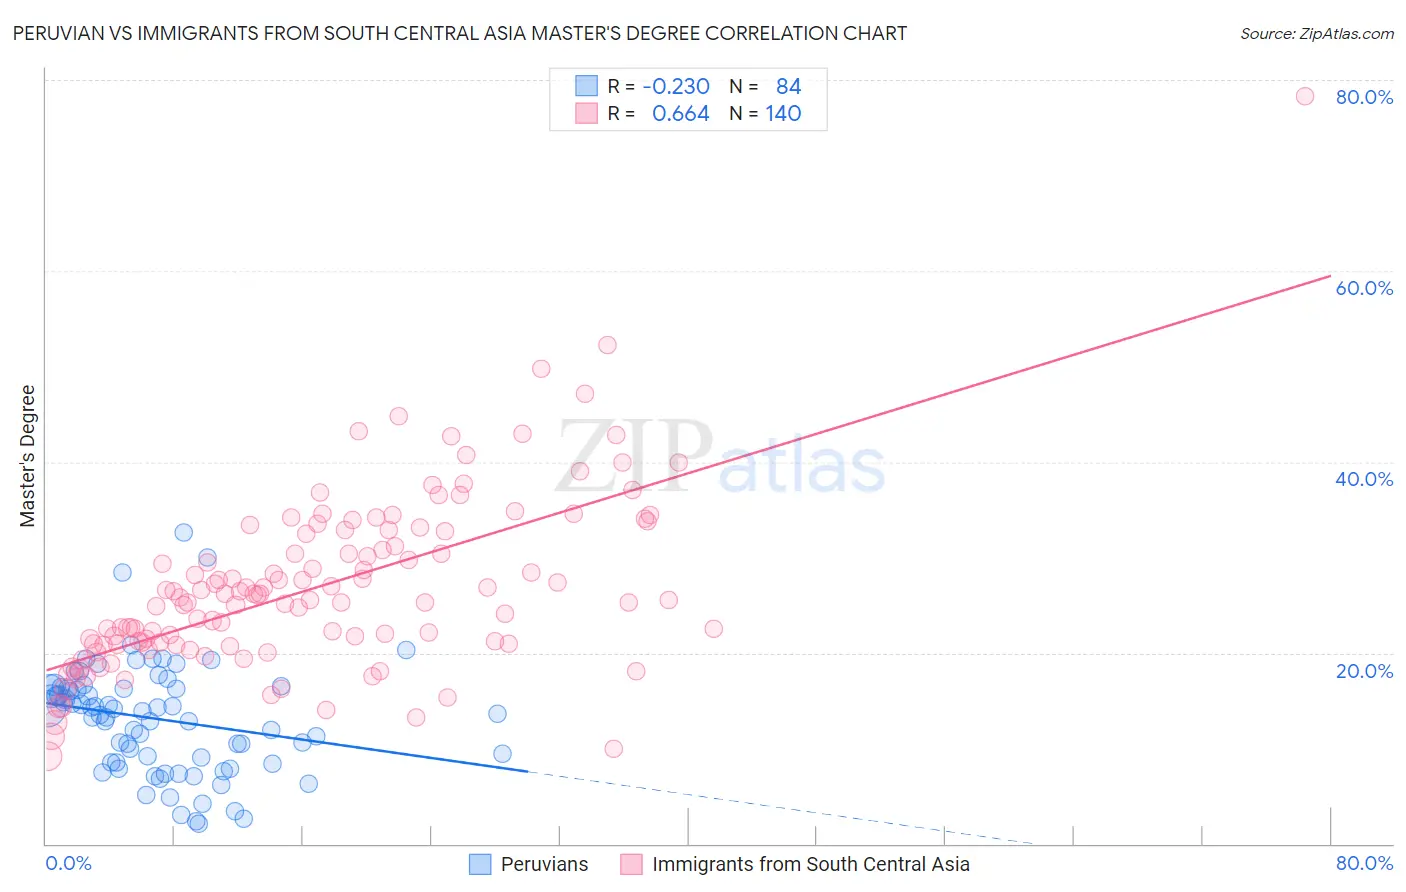
Peruvian vs Immigrants from South Central Asia Master's Degree Correlation Chart
The statistical analysis conducted on geographies consisting of 363,142,286 people shows a weak negative correlation between the proportion of Peruvians and percentage of population with at least master's degree education in the United States with a correlation coefficient (R) of -0.230 and weighted average of 15.3%. Similarly, the statistical analysis conducted on geographies consisting of 472,904,937 people shows a significant positive correlation between the proportion of Immigrants from South Central Asia and percentage of population with at least master's degree education in the United States with a correlation coefficient (R) of 0.664 and weighted average of 20.7%, a difference of 35.4%.
Master's Degree Correlation Summary
| Measurement | Peruvian | Immigrants from South Central Asia |
| Minimum | 2.1% | 9.1% |
| Maximum | 32.6% | 78.4% |
| Range | 30.5% | 69.2% |
| Mean | 13.1% | 26.9% |
| Median | 13.8% | 25.6% |
| Interquartile 25% (IQ1) | 8.6% | 21.0% |
| Interquartile 75% (IQ3) | 16.3% | 32.6% |
| Interquartile Range (IQR) | 7.7% | 11.6% |
| Standard Deviation (Sample) | 5.8% | 9.3% |
| Standard Deviation (Population) | 5.8% | 9.3% |
Similar Demographics by Master's Degree
Demographics Similar to Peruvians by Master's Degree
In terms of master's degree, the demographic groups most similar to Peruvians are Sudanese (15.3%, a difference of 0.010%), Uruguayan (15.3%, a difference of 0.22%), Kenyan (15.3%, a difference of 0.24%), Colombian (15.3%, a difference of 0.25%), and Immigrants from Kenya (15.3%, a difference of 0.29%).
| Demographics | Rating | Rank | Master's Degree |
| Immigrants | Bangladesh | 76.1 /100 | #155 | Good 15.5% |
| Bermudans | 73.9 /100 | #156 | Good 15.4% |
| Immigrants | Cameroon | 71.7 /100 | #157 | Good 15.4% |
| Immigrants | Poland | 71.5 /100 | #158 | Good 15.4% |
| Luxembourgers | 71.0 /100 | #159 | Good 15.3% |
| Kenyans | 70.3 /100 | #160 | Good 15.3% |
| Sudanese | 68.7 /100 | #161 | Good 15.3% |
| Peruvians | 68.7 /100 | #162 | Good 15.3% |
| Uruguayans | 67.1 /100 | #163 | Good 15.3% |
| Colombians | 66.9 /100 | #164 | Good 15.3% |
| Immigrants | Kenya | 66.6 /100 | #165 | Good 15.3% |
| Swedes | 66.1 /100 | #166 | Good 15.2% |
| Senegalese | 65.6 /100 | #167 | Good 15.2% |
| Immigrants | North Macedonia | 64.5 /100 | #168 | Good 15.2% |
| Scottish | 62.7 /100 | #169 | Good 15.2% |
Demographics Similar to Immigrants from South Central Asia by Master's Degree
In terms of master's degree, the demographic groups most similar to Immigrants from South Central Asia are Immigrants from Belgium (20.8%, a difference of 0.26%), Immigrants from Eastern Asia (20.8%, a difference of 0.54%), Immigrants from Switzerland (20.9%, a difference of 0.73%), Immigrants from Australia (20.9%, a difference of 0.74%), and Soviet Union (20.5%, a difference of 0.92%).
| Demographics | Rating | Rank | Master's Degree |
| Immigrants | Iran | 100.0 /100 | #10 | Exceptional 21.6% |
| Immigrants | China | 100.0 /100 | #11 | Exceptional 21.2% |
| Eastern Europeans | 100.0 /100 | #12 | Exceptional 21.1% |
| Immigrants | Australia | 100.0 /100 | #13 | Exceptional 20.9% |
| Immigrants | Switzerland | 100.0 /100 | #14 | Exceptional 20.9% |
| Immigrants | Eastern Asia | 100.0 /100 | #15 | Exceptional 20.8% |
| Immigrants | Belgium | 100.0 /100 | #16 | Exceptional 20.8% |
| Immigrants | South Central Asia | 100.0 /100 | #17 | Exceptional 20.7% |
| Soviet Union | 100.0 /100 | #18 | Exceptional 20.5% |
| Immigrants | Hong Kong | 100.0 /100 | #19 | Exceptional 20.5% |
| Indians (Asian) | 100.0 /100 | #20 | Exceptional 20.5% |
| Immigrants | Ireland | 100.0 /100 | #21 | Exceptional 20.4% |
| Israelis | 100.0 /100 | #22 | Exceptional 20.3% |
| Immigrants | France | 100.0 /100 | #23 | Exceptional 20.3% |
| Immigrants | Sweden | 100.0 /100 | #24 | Exceptional 20.3% |