Immigrants from Albania vs Immigrants from South Central Asia Receiving Food Stamps
COMPARE
Immigrants from Albania
Immigrants from South Central Asia
Receiving Food Stamps
Receiving Food Stamps Comparison
Immigrants from Albania
Immigrants from South Central Asia
13.0%
RECEIVING FOOD STAMPS
4.4/ 100
METRIC RATING
223rd/ 347
METRIC RANK
8.8%
RECEIVING FOOD STAMPS
99.9/ 100
METRIC RATING
10th/ 347
METRIC RANK
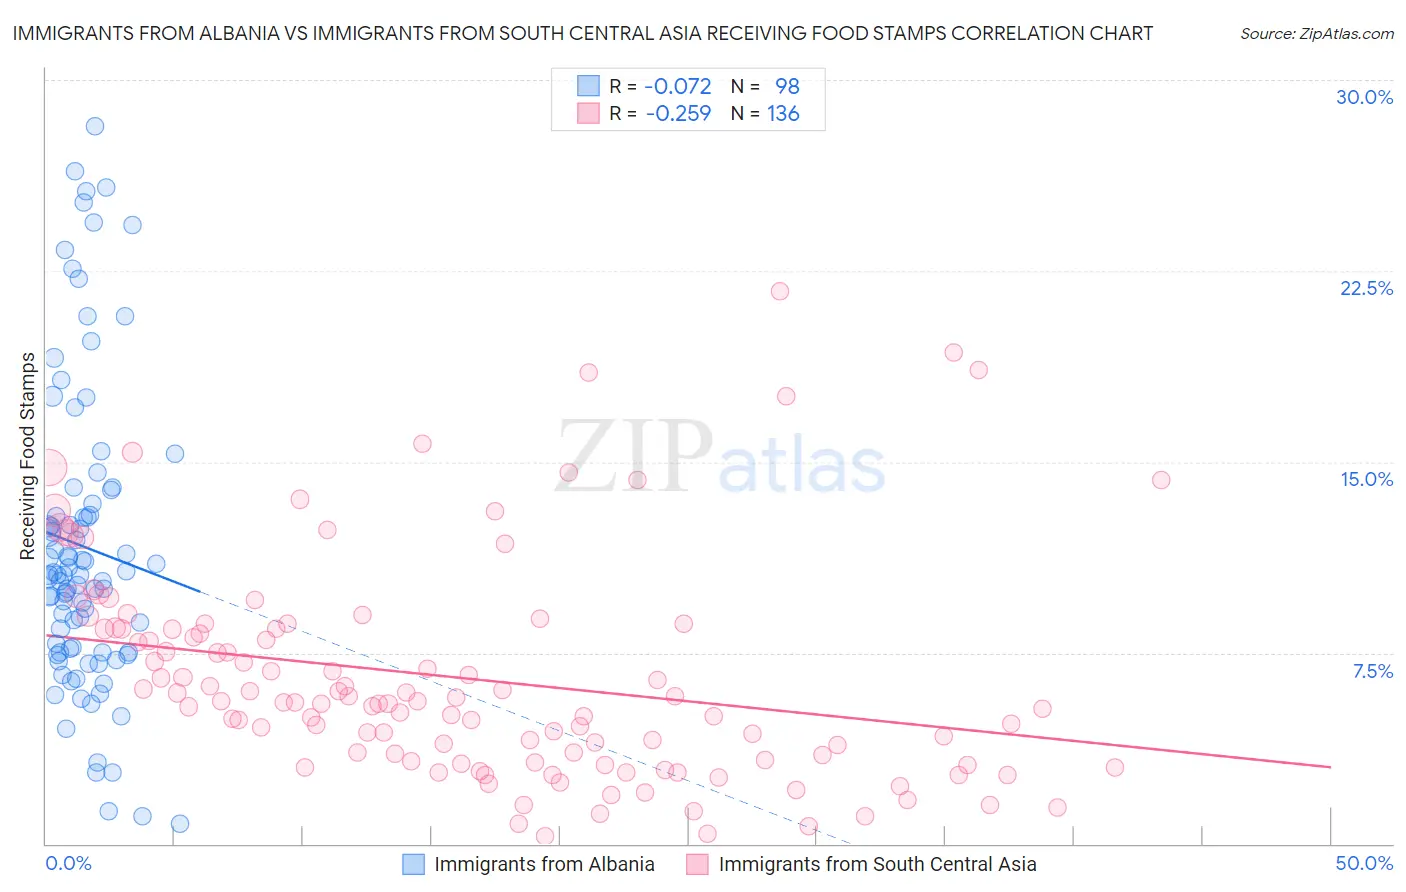
Immigrants from Albania vs Immigrants from South Central Asia Receiving Food Stamps Correlation Chart
The statistical analysis conducted on geographies consisting of 119,244,585 people shows a slight negative correlation between the proportion of Immigrants from Albania and percentage of population receiving government assistance and/or food stamps in the United States with a correlation coefficient (R) of -0.072 and weighted average of 13.0%. Similarly, the statistical analysis conducted on geographies consisting of 471,034,048 people shows a weak negative correlation between the proportion of Immigrants from South Central Asia and percentage of population receiving government assistance and/or food stamps in the United States with a correlation coefficient (R) of -0.259 and weighted average of 8.8%, a difference of 47.2%.
Receiving Food Stamps Correlation Summary
| Measurement | Immigrants from Albania | Immigrants from South Central Asia |
| Minimum | 0.80% | 0.30% |
| Maximum | 28.2% | 21.7% |
| Range | 27.4% | 21.4% |
| Mean | 11.7% | 6.5% |
| Median | 10.6% | 5.6% |
| Interquartile 25% (IQ1) | 7.5% | 3.3% |
| Interquartile 75% (IQ3) | 13.3% | 8.5% |
| Interquartile Range (IQR) | 5.8% | 5.2% |
| Standard Deviation (Sample) | 6.0% | 4.3% |
| Standard Deviation (Population) | 6.0% | 4.3% |
Similar Demographics by Receiving Food Stamps
Demographics Similar to Immigrants from Albania by Receiving Food Stamps
In terms of receiving food stamps, the demographic groups most similar to Immigrants from Albania are Immigrants (13.0%, a difference of 0.040%), Immigrants from Armenia (13.0%, a difference of 0.070%), Fijian (13.0%, a difference of 0.090%), Bermudan (13.0%, a difference of 0.30%), and Immigrants from Colombia (12.9%, a difference of 0.62%).
| Demographics | Rating | Rank | Receiving Food Stamps |
| Immigrants | South America | 6.5 /100 | #216 | Tragic 12.8% |
| Immigrants | Burma/Myanmar | 6.0 /100 | #217 | Tragic 12.9% |
| Hawaiians | 5.4 /100 | #218 | Tragic 12.9% |
| Immigrants | Middle Africa | 5.4 /100 | #219 | Tragic 12.9% |
| Immigrants | Colombia | 5.3 /100 | #220 | Tragic 12.9% |
| Bermudans | 4.8 /100 | #221 | Tragic 13.0% |
| Immigrants | Immigrants | 4.4 /100 | #222 | Tragic 13.0% |
| Immigrants | Albania | 4.4 /100 | #223 | Tragic 13.0% |
| Immigrants | Armenia | 4.3 /100 | #224 | Tragic 13.0% |
| Fijians | 4.3 /100 | #225 | Tragic 13.0% |
| Chickasaw | 3.6 /100 | #226 | Tragic 13.1% |
| Nigerians | 3.5 /100 | #227 | Tragic 13.1% |
| Panamanians | 3.5 /100 | #228 | Tragic 13.1% |
| Ottawa | 3.5 /100 | #229 | Tragic 13.1% |
| Puget Sound Salish | 3.4 /100 | #230 | Tragic 13.1% |
Demographics Similar to Immigrants from South Central Asia by Receiving Food Stamps
In terms of receiving food stamps, the demographic groups most similar to Immigrants from South Central Asia are Okinawan (8.9%, a difference of 0.43%), Cypriot (8.9%, a difference of 0.44%), Bulgarian (8.9%, a difference of 0.63%), Maltese (8.9%, a difference of 0.77%), and Norwegian (9.0%, a difference of 1.4%).
| Demographics | Rating | Rank | Receiving Food Stamps |
| Filipinos | 100.0 /100 | #3 | Exceptional 7.4% |
| Iranians | 100.0 /100 | #4 | Exceptional 7.9% |
| Thais | 100.0 /100 | #5 | Exceptional 8.1% |
| Immigrants | Singapore | 100.0 /100 | #6 | Exceptional 8.3% |
| Immigrants | Iran | 100.0 /100 | #7 | Exceptional 8.3% |
| Burmese | 99.9 /100 | #8 | Exceptional 8.6% |
| Immigrants | Korea | 99.9 /100 | #9 | Exceptional 8.7% |
| Immigrants | South Central Asia | 99.9 /100 | #10 | Exceptional 8.8% |
| Okinawans | 99.9 /100 | #11 | Exceptional 8.9% |
| Cypriots | 99.9 /100 | #12 | Exceptional 8.9% |
| Bulgarians | 99.9 /100 | #13 | Exceptional 8.9% |
| Maltese | 99.9 /100 | #14 | Exceptional 8.9% |
| Norwegians | 99.9 /100 | #15 | Exceptional 9.0% |
| Immigrants | Japan | 99.9 /100 | #16 | Exceptional 9.0% |
| Immigrants | Scotland | 99.9 /100 | #17 | Exceptional 9.0% |