Haitian vs Immigrants from Belize Receiving Food Stamps
COMPARE
Haitian
Immigrants from Belize
Receiving Food Stamps
Receiving Food Stamps Comparison
Haitians
Immigrants from Belize
17.8%
RECEIVING FOOD STAMPS
0.0/ 100
METRIC RATING
323rd/ 347
METRIC RANK
15.2%
RECEIVING FOOD STAMPS
0.0/ 100
METRIC RATING
288th/ 347
METRIC RANK
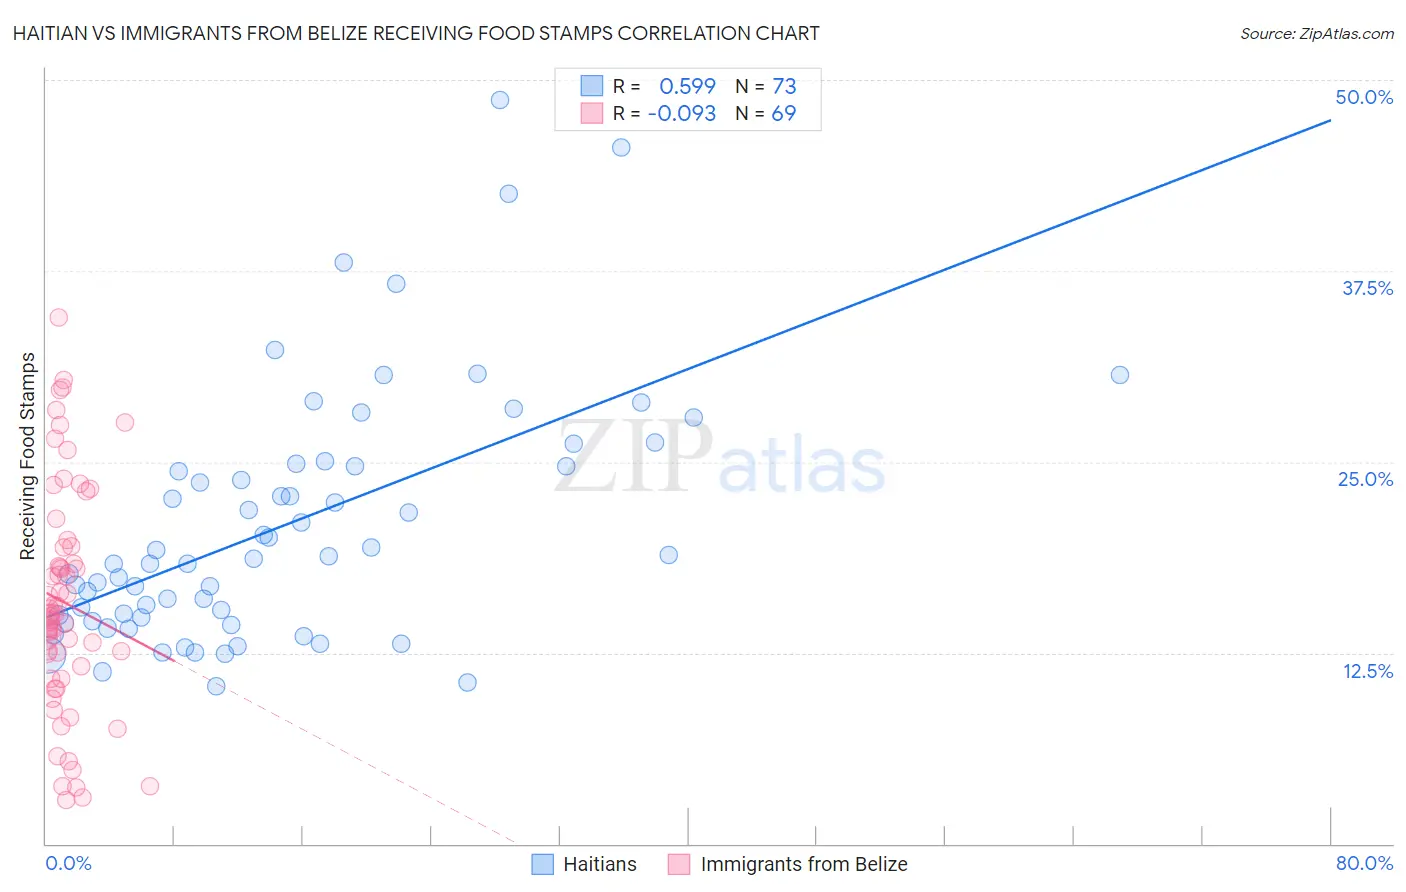
Haitian vs Immigrants from Belize Receiving Food Stamps Correlation Chart
The statistical analysis conducted on geographies consisting of 287,415,058 people shows a substantial positive correlation between the proportion of Haitians and percentage of population receiving government assistance and/or food stamps in the United States with a correlation coefficient (R) of 0.599 and weighted average of 17.8%. Similarly, the statistical analysis conducted on geographies consisting of 130,248,376 people shows a slight negative correlation between the proportion of Immigrants from Belize and percentage of population receiving government assistance and/or food stamps in the United States with a correlation coefficient (R) of -0.093 and weighted average of 15.2%, a difference of 16.8%.
Receiving Food Stamps Correlation Summary
| Measurement | Haitian | Immigrants from Belize |
| Minimum | 10.3% | 2.9% |
| Maximum | 48.7% | 34.5% |
| Range | 38.4% | 31.6% |
| Mean | 20.9% | 15.8% |
| Median | 18.7% | 15.0% |
| Interquartile 25% (IQ1) | 14.7% | 11.2% |
| Interquartile 75% (IQ3) | 24.8% | 19.5% |
| Interquartile Range (IQR) | 10.1% | 8.3% |
| Standard Deviation (Sample) | 8.2% | 7.3% |
| Standard Deviation (Population) | 8.1% | 7.2% |
Similar Demographics by Receiving Food Stamps
Demographics Similar to Haitians by Receiving Food Stamps
In terms of receiving food stamps, the demographic groups most similar to Haitians are Immigrants from Grenada (17.8%, a difference of 0.010%), British West Indian (17.9%, a difference of 0.59%), Immigrants from Haiti (18.2%, a difference of 2.4%), Cuban (18.2%, a difference of 2.5%), and Apache (18.3%, a difference of 2.8%).
| Demographics | Rating | Rank | Receiving Food Stamps |
| Central American Indians | 0.0 /100 | #316 | Tragic 17.1% |
| Blacks/African Americans | 0.0 /100 | #317 | Tragic 17.2% |
| Menominee | 0.0 /100 | #318 | Tragic 17.2% |
| Immigrants | St. Vincent and the Grenadines | 0.0 /100 | #319 | Tragic 17.2% |
| Immigrants | Nicaragua | 0.0 /100 | #320 | Tragic 17.2% |
| Natives/Alaskans | 0.0 /100 | #321 | Tragic 17.3% |
| Immigrants | Grenada | 0.0 /100 | #322 | Tragic 17.8% |
| Haitians | 0.0 /100 | #323 | Tragic 17.8% |
| British West Indians | 0.0 /100 | #324 | Tragic 17.9% |
| Immigrants | Haiti | 0.0 /100 | #325 | Tragic 18.2% |
| Cubans | 0.0 /100 | #326 | Tragic 18.2% |
| Apache | 0.0 /100 | #327 | Tragic 18.3% |
| Colville | 0.0 /100 | #328 | Tragic 18.3% |
| Immigrants | Dominica | 0.0 /100 | #329 | Tragic 18.4% |
| Pima | 0.0 /100 | #330 | Tragic 19.0% |
Demographics Similar to Immigrants from Belize by Receiving Food Stamps
In terms of receiving food stamps, the demographic groups most similar to Immigrants from Belize are Immigrants from Mexico (15.2%, a difference of 0.46%), African (15.1%, a difference of 0.69%), Immigrants from Senegal (15.3%, a difference of 0.77%), Immigrants from Liberia (15.1%, a difference of 0.83%), and Senegalese (15.4%, a difference of 1.0%).
| Demographics | Rating | Rank | Receiving Food Stamps |
| Spanish American Indians | 0.0 /100 | #281 | Tragic 14.9% |
| Immigrants | Central America | 0.0 /100 | #282 | Tragic 15.0% |
| Bangladeshis | 0.0 /100 | #283 | Tragic 15.0% |
| Immigrants | Ecuador | 0.0 /100 | #284 | Tragic 15.0% |
| Immigrants | Liberia | 0.0 /100 | #285 | Tragic 15.1% |
| Africans | 0.0 /100 | #286 | Tragic 15.1% |
| Immigrants | Mexico | 0.0 /100 | #287 | Tragic 15.2% |
| Immigrants | Belize | 0.0 /100 | #288 | Tragic 15.2% |
| Immigrants | Senegal | 0.0 /100 | #289 | Tragic 15.3% |
| Senegalese | 0.0 /100 | #290 | Tragic 15.4% |
| Hondurans | 0.0 /100 | #291 | Tragic 15.5% |
| Alaska Natives | 0.0 /100 | #292 | Tragic 15.6% |
| Vietnamese | 0.0 /100 | #293 | Tragic 15.7% |
| Immigrants | Latin America | 0.0 /100 | #294 | Tragic 15.7% |
| Immigrants | Honduras | 0.0 /100 | #295 | Tragic 15.7% |