Peruvian vs Dutch West Indian Single Female Poverty
COMPARE
Peruvian
Dutch West Indian
Single Female Poverty
Single Female Poverty Comparison
Peruvians
Dutch West Indians
19.4%
SINGLE FEMALE POVERTY
99.4/ 100
METRIC RATING
76th/ 347
METRIC RANK
27.5%
SINGLE FEMALE POVERTY
0.0/ 100
METRIC RATING
327th/ 347
METRIC RANK
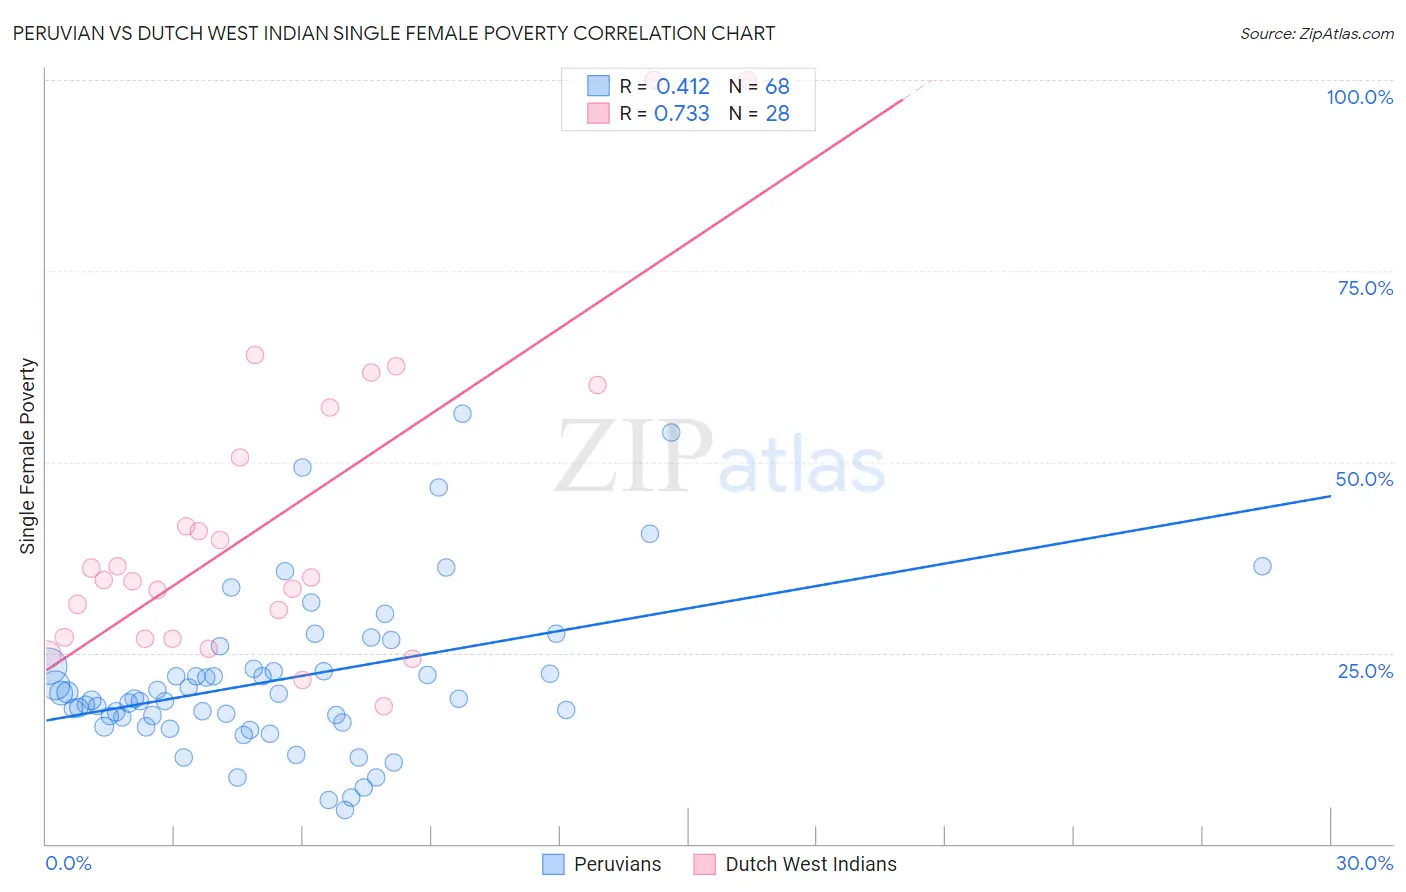
Peruvian vs Dutch West Indian Single Female Poverty Correlation Chart
The statistical analysis conducted on geographies consisting of 358,317,102 people shows a moderate positive correlation between the proportion of Peruvians and poverty level among single females in the United States with a correlation coefficient (R) of 0.412 and weighted average of 19.4%. Similarly, the statistical analysis conducted on geographies consisting of 85,533,400 people shows a strong positive correlation between the proportion of Dutch West Indians and poverty level among single females in the United States with a correlation coefficient (R) of 0.733 and weighted average of 27.5%, a difference of 41.8%.
Single Female Poverty Correlation Summary
| Measurement | Peruvian | Dutch West Indian |
| Minimum | 4.4% | 18.0% |
| Maximum | 56.3% | 100.0% |
| Range | 51.9% | 82.0% |
| Mean | 21.5% | 42.0% |
| Median | 19.0% | 34.7% |
| Interquartile 25% (IQ1) | 16.2% | 27.0% |
| Interquartile 75% (IQ3) | 23.1% | 53.9% |
| Interquartile Range (IQR) | 6.8% | 26.9% |
| Standard Deviation (Sample) | 10.5% | 21.0% |
| Standard Deviation (Population) | 10.5% | 20.6% |
Similar Demographics by Single Female Poverty
Demographics Similar to Peruvians by Single Female Poverty
In terms of single female poverty, the demographic groups most similar to Peruvians are Immigrants from Turkey (19.4%, a difference of 0.040%), Immigrants from Belarus (19.3%, a difference of 0.070%), Immigrants from Peru (19.3%, a difference of 0.090%), Immigrants from Russia (19.4%, a difference of 0.13%), and Immigrants from South Eastern Asia (19.3%, a difference of 0.19%).
| Demographics | Rating | Rank | Single Female Poverty |
| Paraguayans | 99.5 /100 | #69 | Exceptional 19.3% |
| Immigrants | Jordan | 99.4 /100 | #70 | Exceptional 19.3% |
| Immigrants | South Eastern Asia | 99.4 /100 | #71 | Exceptional 19.3% |
| Immigrants | Latvia | 99.4 /100 | #72 | Exceptional 19.3% |
| Immigrants | Peru | 99.4 /100 | #73 | Exceptional 19.3% |
| Immigrants | Belarus | 99.4 /100 | #74 | Exceptional 19.3% |
| Immigrants | Turkey | 99.4 /100 | #75 | Exceptional 19.4% |
| Peruvians | 99.4 /100 | #76 | Exceptional 19.4% |
| Immigrants | Russia | 99.3 /100 | #77 | Exceptional 19.4% |
| Albanians | 99.3 /100 | #78 | Exceptional 19.4% |
| Immigrants | Sierra Leone | 99.3 /100 | #79 | Exceptional 19.4% |
| Immigrants | Australia | 99.3 /100 | #80 | Exceptional 19.4% |
| Immigrants | Scotland | 99.2 /100 | #81 | Exceptional 19.4% |
| Immigrants | Malaysia | 99.2 /100 | #82 | Exceptional 19.4% |
| Taiwanese | 99.2 /100 | #83 | Exceptional 19.4% |
Demographics Similar to Dutch West Indians by Single Female Poverty
In terms of single female poverty, the demographic groups most similar to Dutch West Indians are Creek (27.4%, a difference of 0.080%), Apache (27.7%, a difference of 0.91%), Choctaw (27.2%, a difference of 0.96%), Menominee (27.8%, a difference of 1.4%), and Kiowa (26.9%, a difference of 1.9%).
| Demographics | Rating | Rank | Single Female Poverty |
| Arapaho | 0.0 /100 | #320 | Tragic 26.4% |
| Yup'ik | 0.0 /100 | #321 | Tragic 26.6% |
| Seminole | 0.0 /100 | #322 | Tragic 26.8% |
| Chippewa | 0.0 /100 | #323 | Tragic 26.8% |
| Kiowa | 0.0 /100 | #324 | Tragic 26.9% |
| Choctaw | 0.0 /100 | #325 | Tragic 27.2% |
| Creek | 0.0 /100 | #326 | Tragic 27.4% |
| Dutch West Indians | 0.0 /100 | #327 | Tragic 27.5% |
| Apache | 0.0 /100 | #328 | Tragic 27.7% |
| Menominee | 0.0 /100 | #329 | Tragic 27.8% |
| Hopi | 0.0 /100 | #330 | Tragic 28.0% |
| Natives/Alaskans | 0.0 /100 | #331 | Tragic 28.2% |
| Yakama | 0.0 /100 | #332 | Tragic 28.3% |
| Ute | 0.0 /100 | #333 | Tragic 28.4% |
| Pueblo | 0.0 /100 | #334 | Tragic 28.6% |